Whittakerr
Putting the Whittaker biome diagram to work
Preface

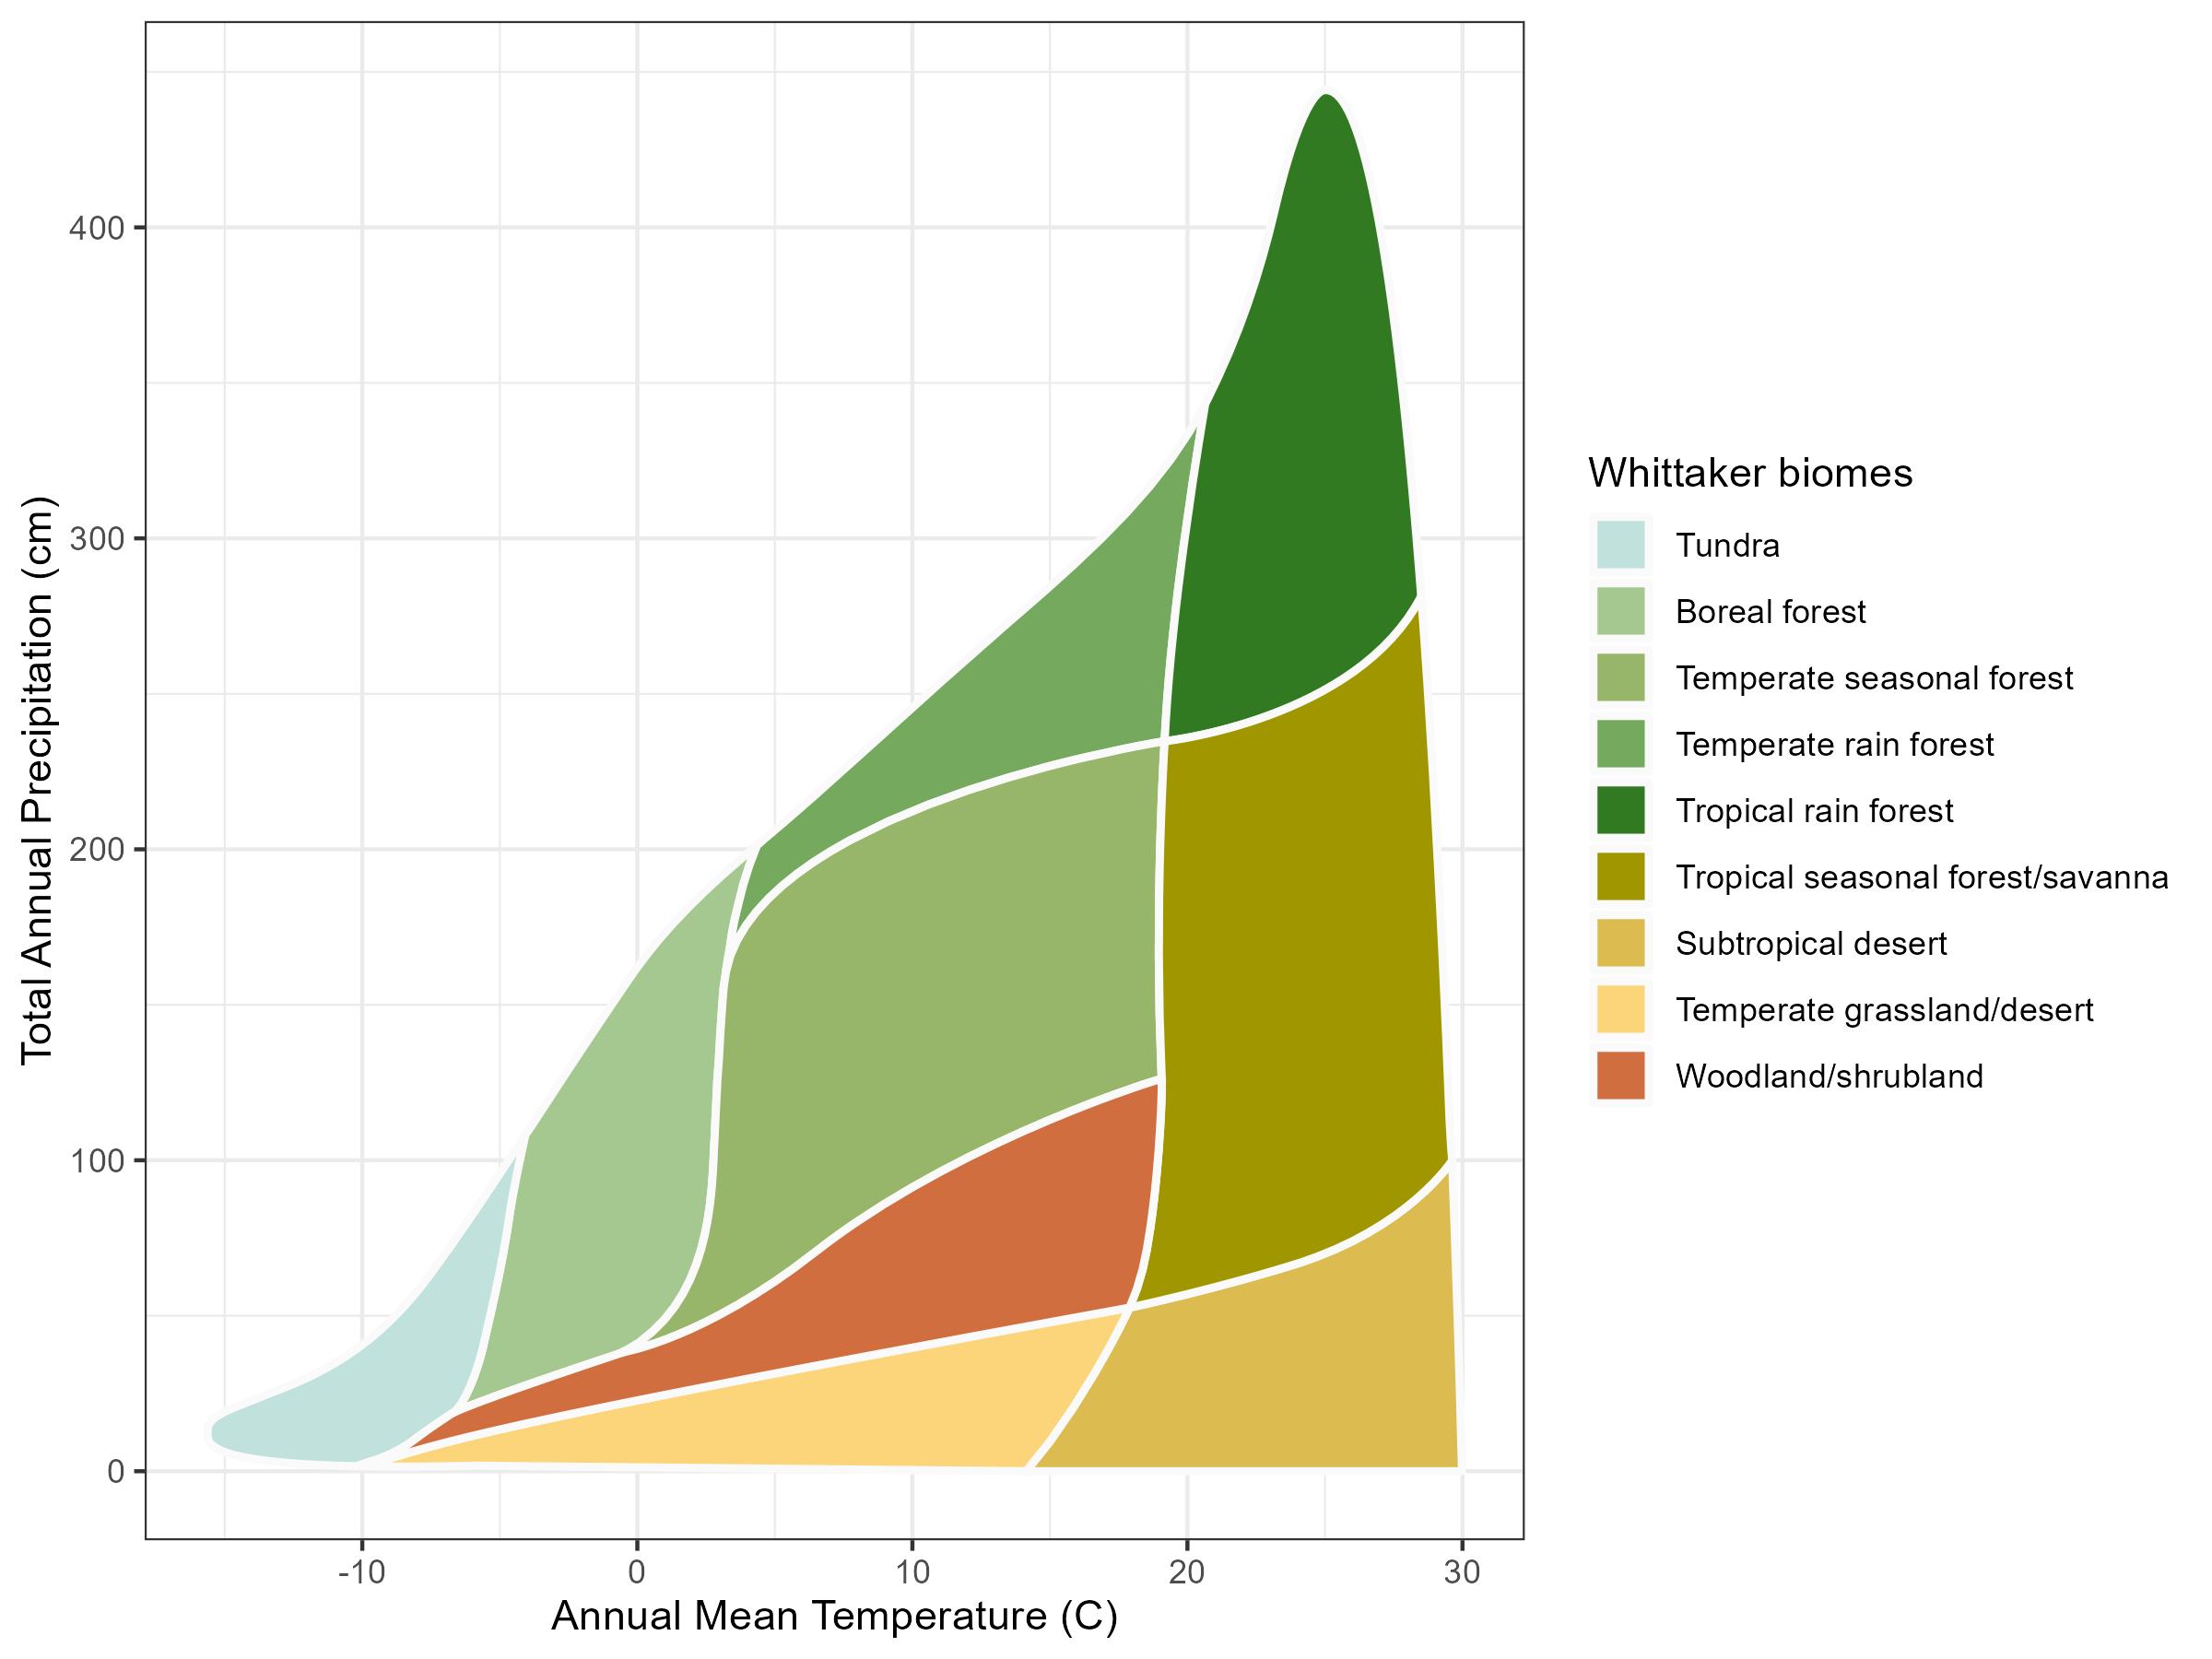
The Whittaker diagram is one of ecology’s most enduring classifications. It plots biomes in a two-dimensional climate space, with annual mean temperature on one axis and annual precipitation on the other. Each region of that space gets a biome that climate selects for. Tropical rain forest sits in the warm and wet corner. Tundra sits in the cold and dry corner. The framework is intuitive, teachable, and has carried half a century of ecological pedagogy.
It is also, in its original form, a set of categories that its author drew by hand, on the basis of subjective expert judgment. Robert Whittaker proposed the diagram in the 1960s and 1970s. Two practical constraints made anything more rigorous unavailable to him. Climate data were sparse. In my own work on the International Biological Program’s Desert Biome project in the early 1970s, the climate group required thousands of dollars to establish a single new weather station, and a worldwide grid of climate values was an investment beyond imagination. Cartography was a manual art practiced in academic mapping centers with copy cameras and ruby cutters. Drawing a world biome map at any resolution finer than the continental was a major undertaking. Putting climate values into a queryable form, applying a classifier to every location on Earth, and rendering the result as a global map were all out of reach.
Both constraints have lifted in the last two decades. WorldClim and similar projects distribute monthly climate data at fine spatial resolution for the entire land surface of the planet, freely available. R and its geospatial libraries make point-in-polygon classification, raster manipulation, and map rendering operations that any researcher with a laptop can perform. Google Earth lets the resulting maps drape over real terrain in three dimensions. The toolkit Whittaker would have needed exists now.
This document uses that toolkit to do something Whittaker could not. It takes his categories from subjective proposal to objective verification. Every chapter that follows is, in one way or another, a step in that transition. The early chapters establish what biomes are conceptually and how the original framework decided where to draw the polygons. The middle chapters build the technical machinery: climate data retrieval, point classification, diagram plotting. The later chapters use the machinery to map biomes back onto geography, first in two dimensions and then in three. The last of those, the three-dimensional view in Google Earth, lets us check whether the polygons Whittaker drew from intuition reproduce the patterns climate has actually produced on the Earth’s surface. They do, remarkably well, with informative exceptions where they don’t.
This pattern is not unique to ecology. Sciences advance when tools from outside their own boundaries become available. Astronomy was transformed by the telescope, biology by the microscope, oceanography by sonar, ecology by satellite remote sensing. The arrival of curated global climate data is one of these moments for the ecology of vegetation. The tools are not ours, in the sense that ecologists did not build WorldClim or develop the algorithms that interpolated it from station records. But the tools enable us to ask and answer questions about our discipline that were structurally unanswerable before.
One specific debt belongs here. The Whittaker biome polygons that this document draws and queries were traced from Ricklefs’s published form into a digital, machine-readable shape by the plotbiomes R package (valentinitnelav.github.io/plotbiomes), and the polygon data bundled with the whittakerr package comes directly from it. The project itself took early inspiration from plotbiomes — what would be possible if those polygons were paired with a global classifier and modern climate data? — so the debt runs deeper than the data alone.
This document is for occasional R users with an interest in ecology, biogeography, or climate. The R code is shown in foldable chunks, and the prose explains what the code is doing and why. Each chapter can be read on its own, though they build on each other in sequence. By the end, the reader should be able to retrieve climate data for any point on Earth, classify that point into a Whittaker biome, plot single points or sets of points on the diagram, generate biome maps for regions of arbitrary size, and visualize those maps on Google Earth’s three-dimensional terrain. Each of these is a piece of the verification machinery that lets Whittaker’s framework do work it could not do in 1975.