| Car | Years | Miles per gallon | Paid per gallon | Cents per mile |
|---|---|---|---|---|
| TwoRed | 2010-2017 | 39.25 | $3.67 | 9.36 |
| Creamsicle | 2021-2024 | 39.66 | $4.69 | 11.83 |
11 What the car cost
11.1 The number everybody asks for
39.3 miles per gallon over 71,177 miles, at 9.36 cents a mile for fuel.
That’s TwoRed’s whole mainland life in one line, and it’s worth a moment on how it was worked out, because there are three defensible answers and they aren’t the same.
The mean of the per-tank figures is 39.53. The median is 39.12. The figure above is neither. It’s total miles divided by total gallons, which is the only one that weights a big tank more heavily than a small one, and it’s the only one that answers the question you’d actually ask: how much fuel did this car use? The other two answer “what was a typical tank like,” which is a different question and a less interesting one.
Partial fills are out of all of it, and they’ve got to be. A tank that wasn’t filled to the brim puts the miles over the wrong denominator, and the record flags them, which is how the last fill of TwoRed’s mainland life, at 92.95 miles per gallon, stays out of a chapter about economy. That was a tank deliberately run down before the car went on a ship, not a miracle.
11.2 Two cars, ten years apart, and the same car
Creamsicle covered 28,613 miles a decade later, on the other side of the country, and it’s the only real check this book has got on whether any of TwoRed’s figures are about Smart cars or just about one Smart car.
Creamsicle cost 26 percent more per mile to run. And here’s the whole of that difference, taken apart:
- the fuel it bought was 28 percent more expensive
- its economy was 1 percent better, which gives a little back
That’s it. Twenty-six percent, and twenty-eight of it is the price of gas.
The two cars are 39.25 and 39.66 miles per gallon. Four tenths of a mile per gallon apart, across sixteen years, two owners’ worth of driving habits, two coasts and two completely different sets of roads. One of them crossed the continent four times and went to the Arctic. The other did the Midwest and the West.
I find that steadier than I expected. The car is a constant. What changed underneath it was the world.
11.3 The three things that could have moved it
There were three obvious candidates for what moves the economy about, and the record’s got something to say about each.
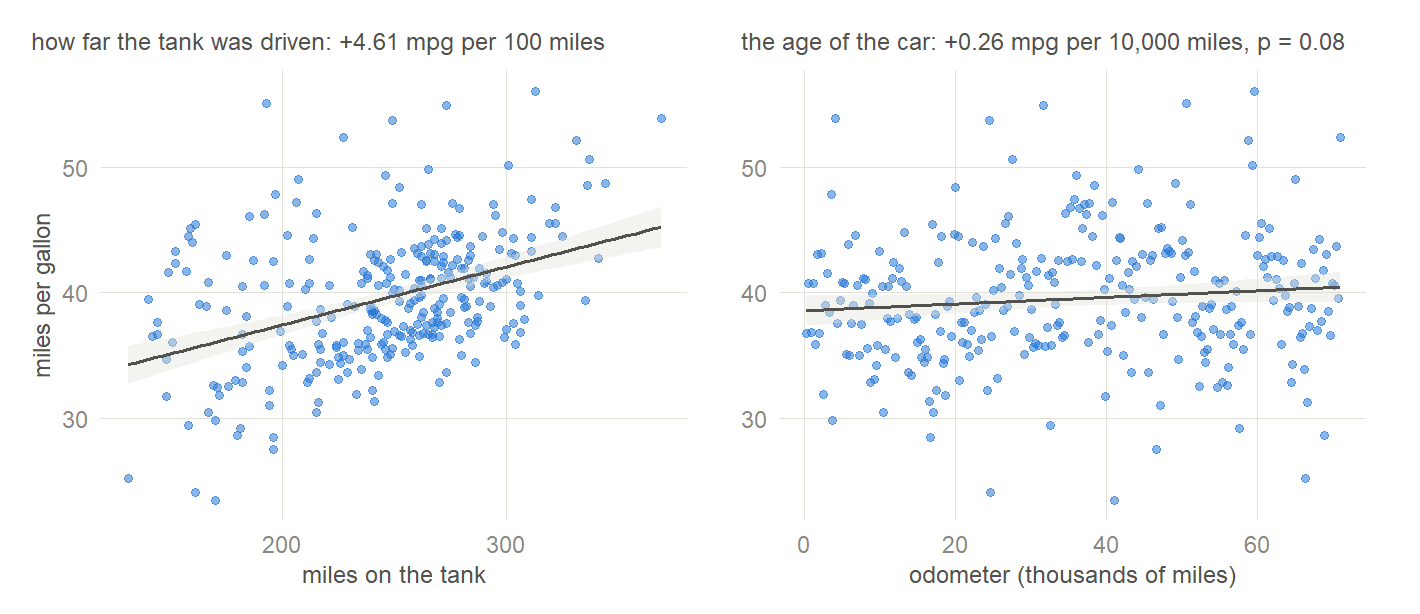
How far you drove on the tank. This is the big one and it isn’t close. +4.61 miles per gallon for every extra hundred miles, and it survives everything I can throw at it. A cold engine, a town, a set of traffic lights and a parking lot all get charged to the same tank, and the more highway you put behind them the less they’re worth. It’s the single strongest thing in this dataset and it’s about the trip, not the car.
The age of the car. Everybody expects an old small engine to get thirstier. It doesn’t. The slope over 71,177 miles is +0.26 miles per gallon per ten thousand. That’s positive, and at p = 0.08 not distinguishable from flat. Allow for the fact that the later years had more long-distance driving in them and it firms up slightly, to +0.30 per ten thousand at p = 0.03.
I’m not going to claim the car improved. What I’ll claim is the useful half: across a whole life, sixteen years and seventy thousand miles, there is no decline here to find. Whatever this car was doing in 2010, it was still doing in 2017.
The wheels. In Chapter 2 I put wider tires on it, for control in a crosswind rather than for fuel, and the received wisdom says wider tires cost you economy. Comparing 52 narrow-tire fills against 213 wide ones, with tank length controlled: +2.8%, with an interval from -0.9% to +6.5%.
That interval contains zero, and it contains most of what anybody would argue about. The honest reading is that this record cannot tell you whether the wheels cost anything, and after 213 tanks on the wide ones, that’s an answer of a sort. Whatever the modification did, it wasn’t big enough to find.
11.4 What I thought I was doing
Two more, and these are the ones where my own beliefs are on the table.
Following the trucks. I’ve said in Chapter 2 that I fell in behind trucks and went slower, and that at the lower speed I felt I was saving fuel. Testing it needs an instrument, because a tank and a driving day don’t line up. Taking only the forty-four tanks that sit entirely inside a single leg, and attaching that day’s speed to them, the correlation runs the way I said: slower days, better economy, at a rank correlation of −0.36. Then put the length of the tank into the same model and the speed term collapses.
So the feeling isn’t contradicted and it isn’t confirmed. What it’s tangled with is the thing that dominates everything else in this chapter, because a slow day behind trucks is usually also a long day on a highway. I said felt at the time and I’ll leave it there.
Costco. Here I did better than I’d have guessed. Matching every Costco fill against the ordinary fills within three weeks either side, the discount runs about twenty cents a gallon, eleven of thirteen comparisons the same way. It’s the one purchasing decision in sixteen years I can prove I made, and I made it while telling myself I mostly picked stations for a clean restroom.
11.5 One caveat that changes every price on this page
Smart cars take premium fuel.
There’s no column in the log for grade, so I can’t show it from the data. You’ve got my word for it. But it means every price in this book is a premium price, and any comparison to a national average, which is quoted for regular, will make this car look more expensive to run than it was. The economy figures are unaffected. The cost figures carry a surcharge that was never optional.
11.6 What it actually cost
71,177 miles of TwoRed’s mainland life took $6,663 of fuel. Creamsicle’s 28,613 took $3,384.
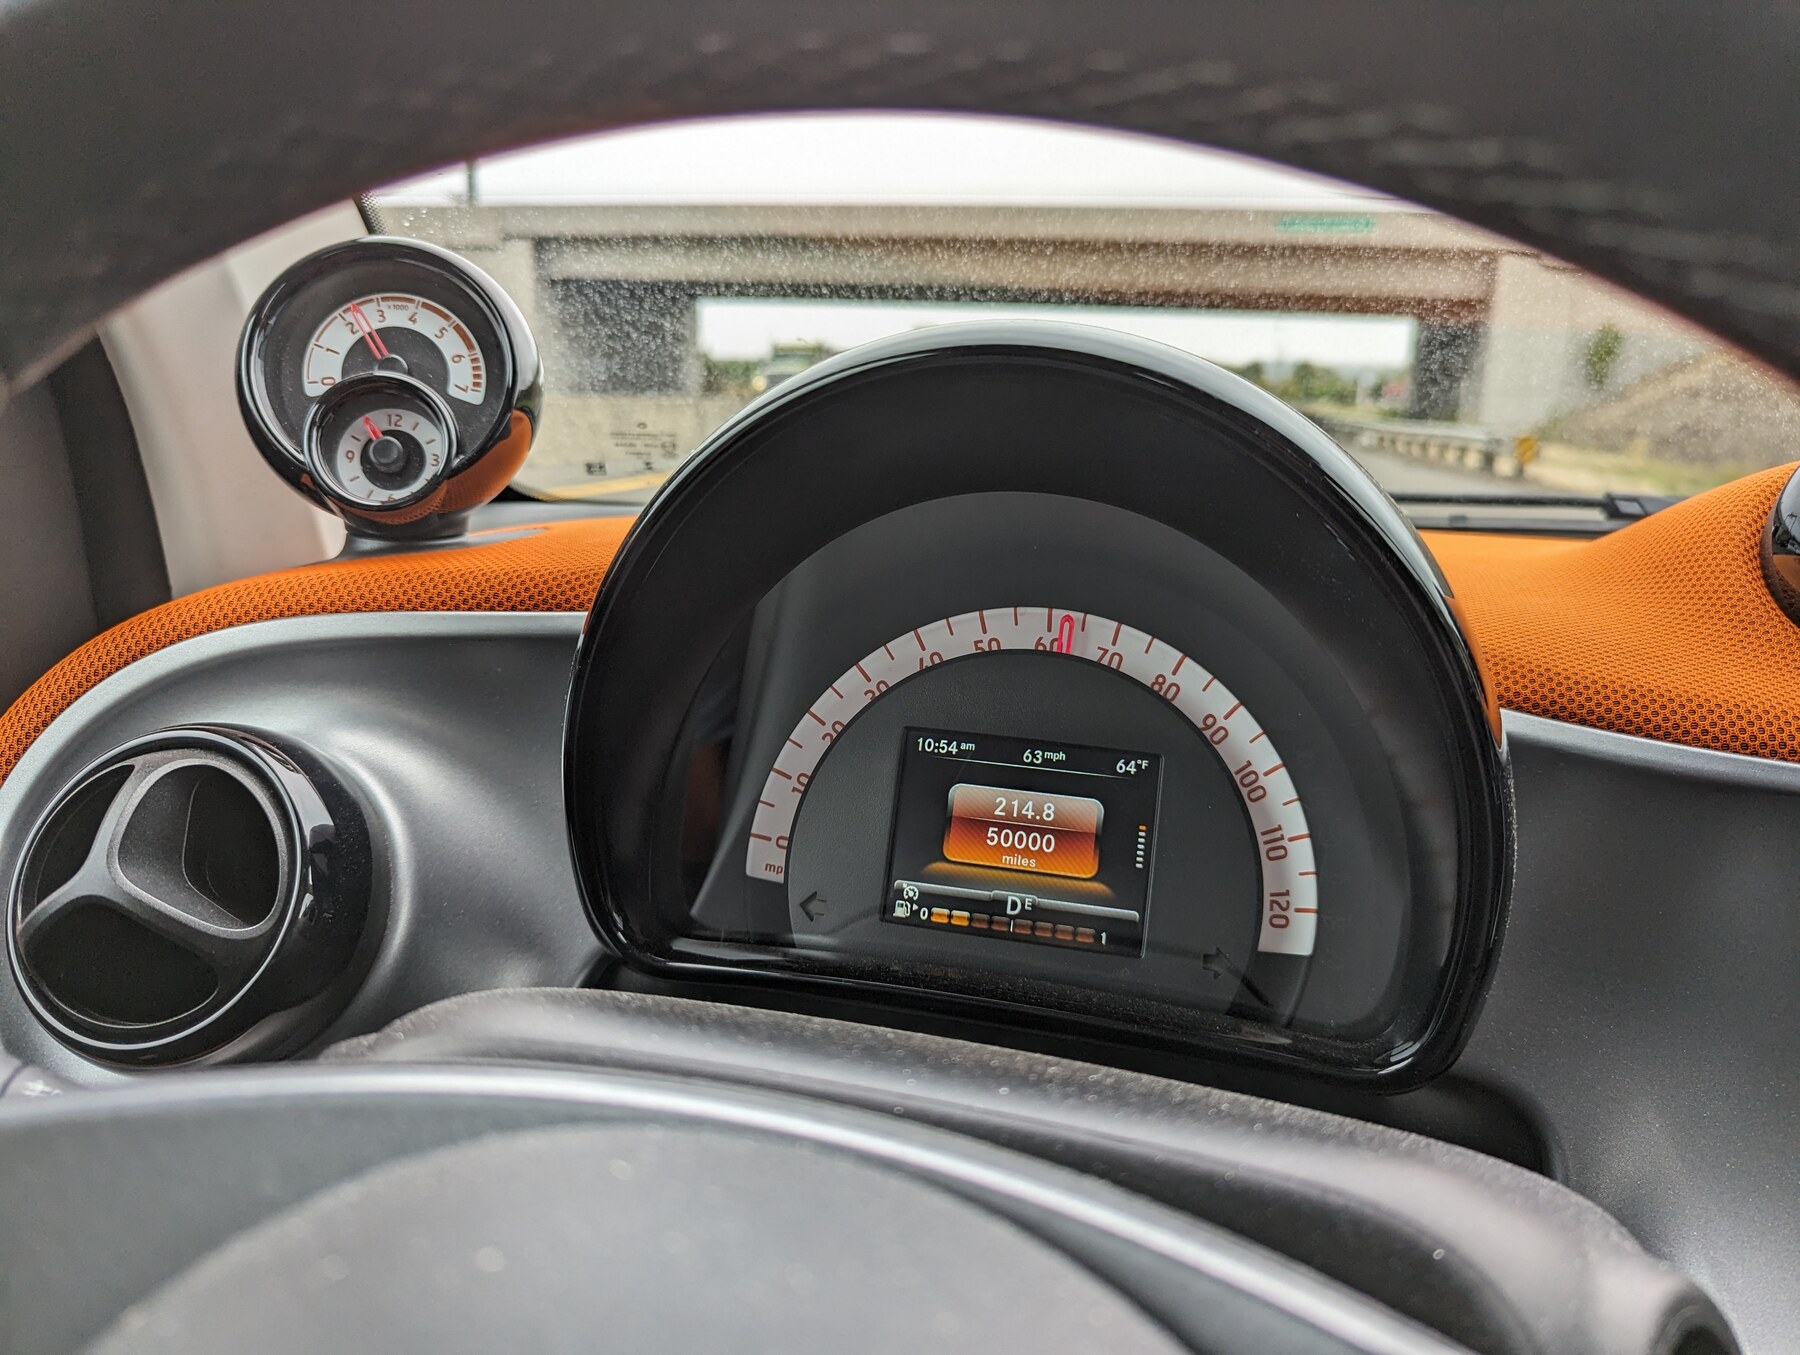
That isn’t a small amount of money, and it’s a remarkably small amount of money, depending entirely on what you set it against, which is why I haven’t. What the record supports is narrower and more useful than a verdict: at nine and a half cents a mile in one decade and twelve in the next, the fuel was never the reason to think twice about the trip.
And the thing that moved the number most wasn’t the car, or the tires, or how I drove. It was how far I was going. Which is the same finding as Chapter 5 reached from the other end, and it means the cheapest way to run this car was the way we happened to use it: badly suited to errands, and very well suited to crossing a continent.