12 A day in a Smart
12.1 What a day actually looked like
After eleven chapters of continents and audits, here’s the small thing underneath all of it.
A day in this car was about 274 miles and about 6 hours. The middle half of Creamsicle’s days ran from 226 to 328 miles and from 5 to 8 hours. TwoRed’s 139 recorded legs sit a little longer, 305 miles at the median with a middle half from 216 to 372, and about 7.8 hours on the clock.
That’s the whole answer to the question people ask, and it’s close enough to Chapter 5’s three hundred miles that I’d say the rule of thumb I worked out in the field was right. But it’s also the least interesting way to describe a day, because it describes a day as a quantity of driving, and most of these days weren’t only driving.
The trouble is proving that. A trip log samples the day twice, as Chapter 8 had to spend a whole chapter admitting, and two points can’t tell you what happened between them.
Except that the second car’s sheet had two more columns on it.
12.2 The column that measures nothing happening
Creamsicle’s form has a place for stopped time, and TwoRed’s doesn’t. That one difference is the reason this chapter exists.
Here’s what it says. Across 84 timed legs the median stopped time is 0.25 hours, which is fifteen minutes, and 40 of the 84 legs record no stopped time at all. Over the whole record, stopped hours are 12.3 percent of all the time the car was out.
So the first finding is a deflating one. Most days really were just driving. You get in, you go, you stop for fuel and you don’t write it down because a fuel stop isn’t a stop, it’s a tax. Twelve percent is not a lot of standing around for sixteen years of what I’d have called traveling.
But that twelve percent isn’t spread evenly, and the way it clumps is the whole story.
12.3 A column nobody had to fill in
There’s one more column on Creamsicle’s sheet: a free-text box at the end of the row, with no instructions and no requirement. I filled it in 35 times out of 84, which is 42 percent, and I did it entirely by whim. Some days I wrote “Lunch.” Some days I wrote nothing at all after twelve hours and three hundred miles.
I want to be plain that no method was involved. Nobody designed that column as an instrument, the same way nobody put three columns on the fuel form so they’d multiply. It was there because the form had room, which is the same accident Chapter 9 is built on.
And it turns out to be the sharpest instrument in this book.
Legs with a comment: median 0.75 hours stopped, and only 4 of the 35 show zero. Legs without one: median 0.00 hours, and 36 of 49 show zero. The two distributions separate at p = 2.4e-07.
Put it the way that matters. 42 percent of the legs carry 73 percent of all the stopped time in the record. Whether I felt like writing a word at the end of a row predicts, better than anything else on the sheet, whether that day had anything in it besides the road.
12.4 Three ways it could have been something else
That’s a striking claim and there are two duller explanations for it, so I tested both.
Maybe the commented days were just different days. Shorter ones, or scenic detours, or the days near a city. If so, the miles should differ.
They don’t. Commented legs run a median 272 miles. Silent legs run 276. At p = 0.97, those are the same number. Whatever the comment marks, it isn’t a shorter day.
Maybe they were slower days. Bad roads, or towns, or the following-the-trucks habit from Chapter 2. And on the face of it that’s exactly what it looks like: gross speed 38.1 miles an hour on commented legs against 49.4 on silent ones, a gap of 11.3 and significant at p = 0.002.
Now take the stopped hours out and ask again. Net speed 47.3 against 51.6. A gap of 4.3, at p = 0.36, which is to say no difference anybody could defend.
Same distance. Same driving. The only thing that separates the two kinds of day is time the car spent standing still.
That’s about as clean as this record ever gets. 62 percent of the apparent speed difference is not speed at all, and the free-text column that nobody asked me to fill in is, functionally, a stopped-time detector that I built by accident and used for three years without noticing.
12.5 What made a day stop
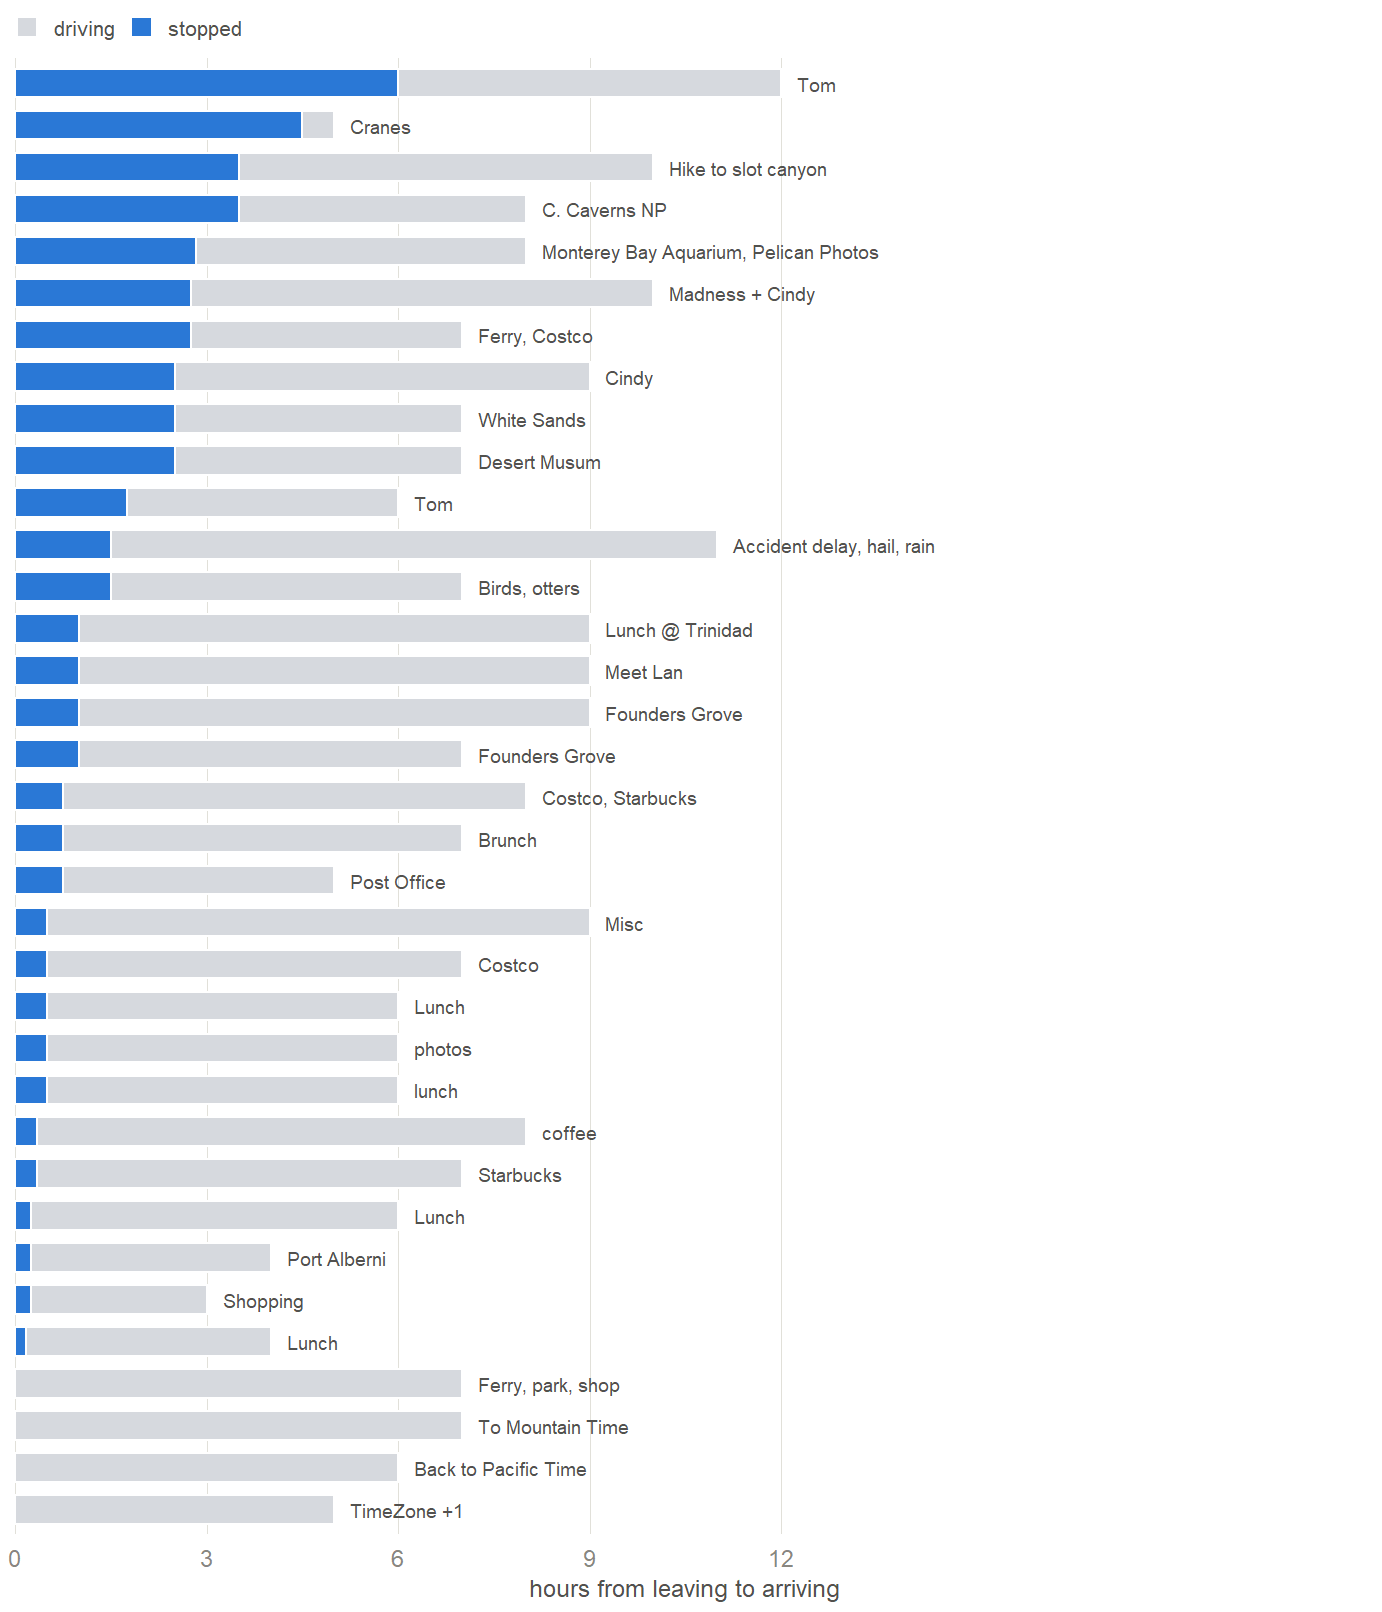
Reading down that figure is the closest thing this book has to a diary.
| Why the day stopped | Days |
|---|---|
| something to look at | 11 |
| something to eat | 9 |
| somebody to see | 5 |
| an errand | 4 |
| the clock | 3 |
| the ferry | 2 |
| weather, or a wreck | 1 |
Something to look at is the largest category, and it isn’t close. Cranes, caverns, a slot canyon, white sand, an aquarium, a grove of founders. Then something to eat, which is mostly the word “Lunch” and is the most ordinary thing in the record. Then people: 5 days that stopped because somebody was there.
The longest of them all is the top bar. Springfield, Illinois to Liberty, Missouri, 307 miles in 12 hours, half of it stopped, and the comment is one word: Tom. That’s a name. Six hours of a twelve-hour day were a person, and the sheet gives them three letters.
The birds in Chapter 8 are the other extreme of the same thing: fifty miles, five hours, and the driving was half an hour of it.
12.6 The four that prove the column was doing two jobs
There are 4 commented legs that record no stopped time whatsoever, and they’re worth more than their number.
| Date | From | To | Miles | Hours | What I wrote |
|---|---|---|---|---|---|
| 10 Oct 2024 | Tucson | Las Cruces | 272.5 | 5 | TimeZone +1 |
| 14 Mar 2023 | St. George | Lone Pine | 410.0 | 6 | Back to Pacific Time |
| 05 Mar 2023 | Victorville | Springdale | 344.9 | 7 | To Mountain Time |
| 24 Sep 2023 | Campbell River | Vancouver | 100.8 | 7 | Ferry, park, shop |
Three of the four are notes about the clock. A time zone isn’t an event, it’s a correction, and I was writing it in the comment box because the comment box was where anything unusual went and there was nowhere else to put it. Those rows are the column being used for a completely different purpose, and they’re the reason I’d never claim the detector is clean. It’s got a category of false positives and they announce themselves.
The fourth one is more honest and less comfortable. 24 September 2023, Campbell River to Vancouver, and what I wrote was “Ferry, park, shop.” A ferry, a park and some shopping, in 7 hours for 101 miles, and the stopped-time cell says zero.
That day plainly had stops in it. I just didn’t put a number on them. Which is the limit of every instrument in this book, stated as plainly as I know how: the record holds what got written down, not what happened. The comment column caught that day. The stopped-time column, the one actually designed for the job, missed it entirely.
12.7 The thing the numbers were for
So here’s what eleven chapters of miles and dollars and errata come to when you look at a single day.
The median day was 274 miles and 6 hours, and on the 49 legs that got no comment at all it really was just that: an early start, a long quiet run, a motel. That’s what the car was for and it’s what it was good at. Chapter 11 says the fuel cost about a dime a mile, and Chapter 5 says three hundred miles was what a person could do in a day, and both of those are true of nearly every row in this record.
And then 42 percent of the time I wrote a word in a box, and that word turns out to mark the days that were about something. Not slower days. Not shorter days. Days with a person or a canyon or a bird in them, where the car sat in a parking lot for an hour or six while the trip happened outside it.

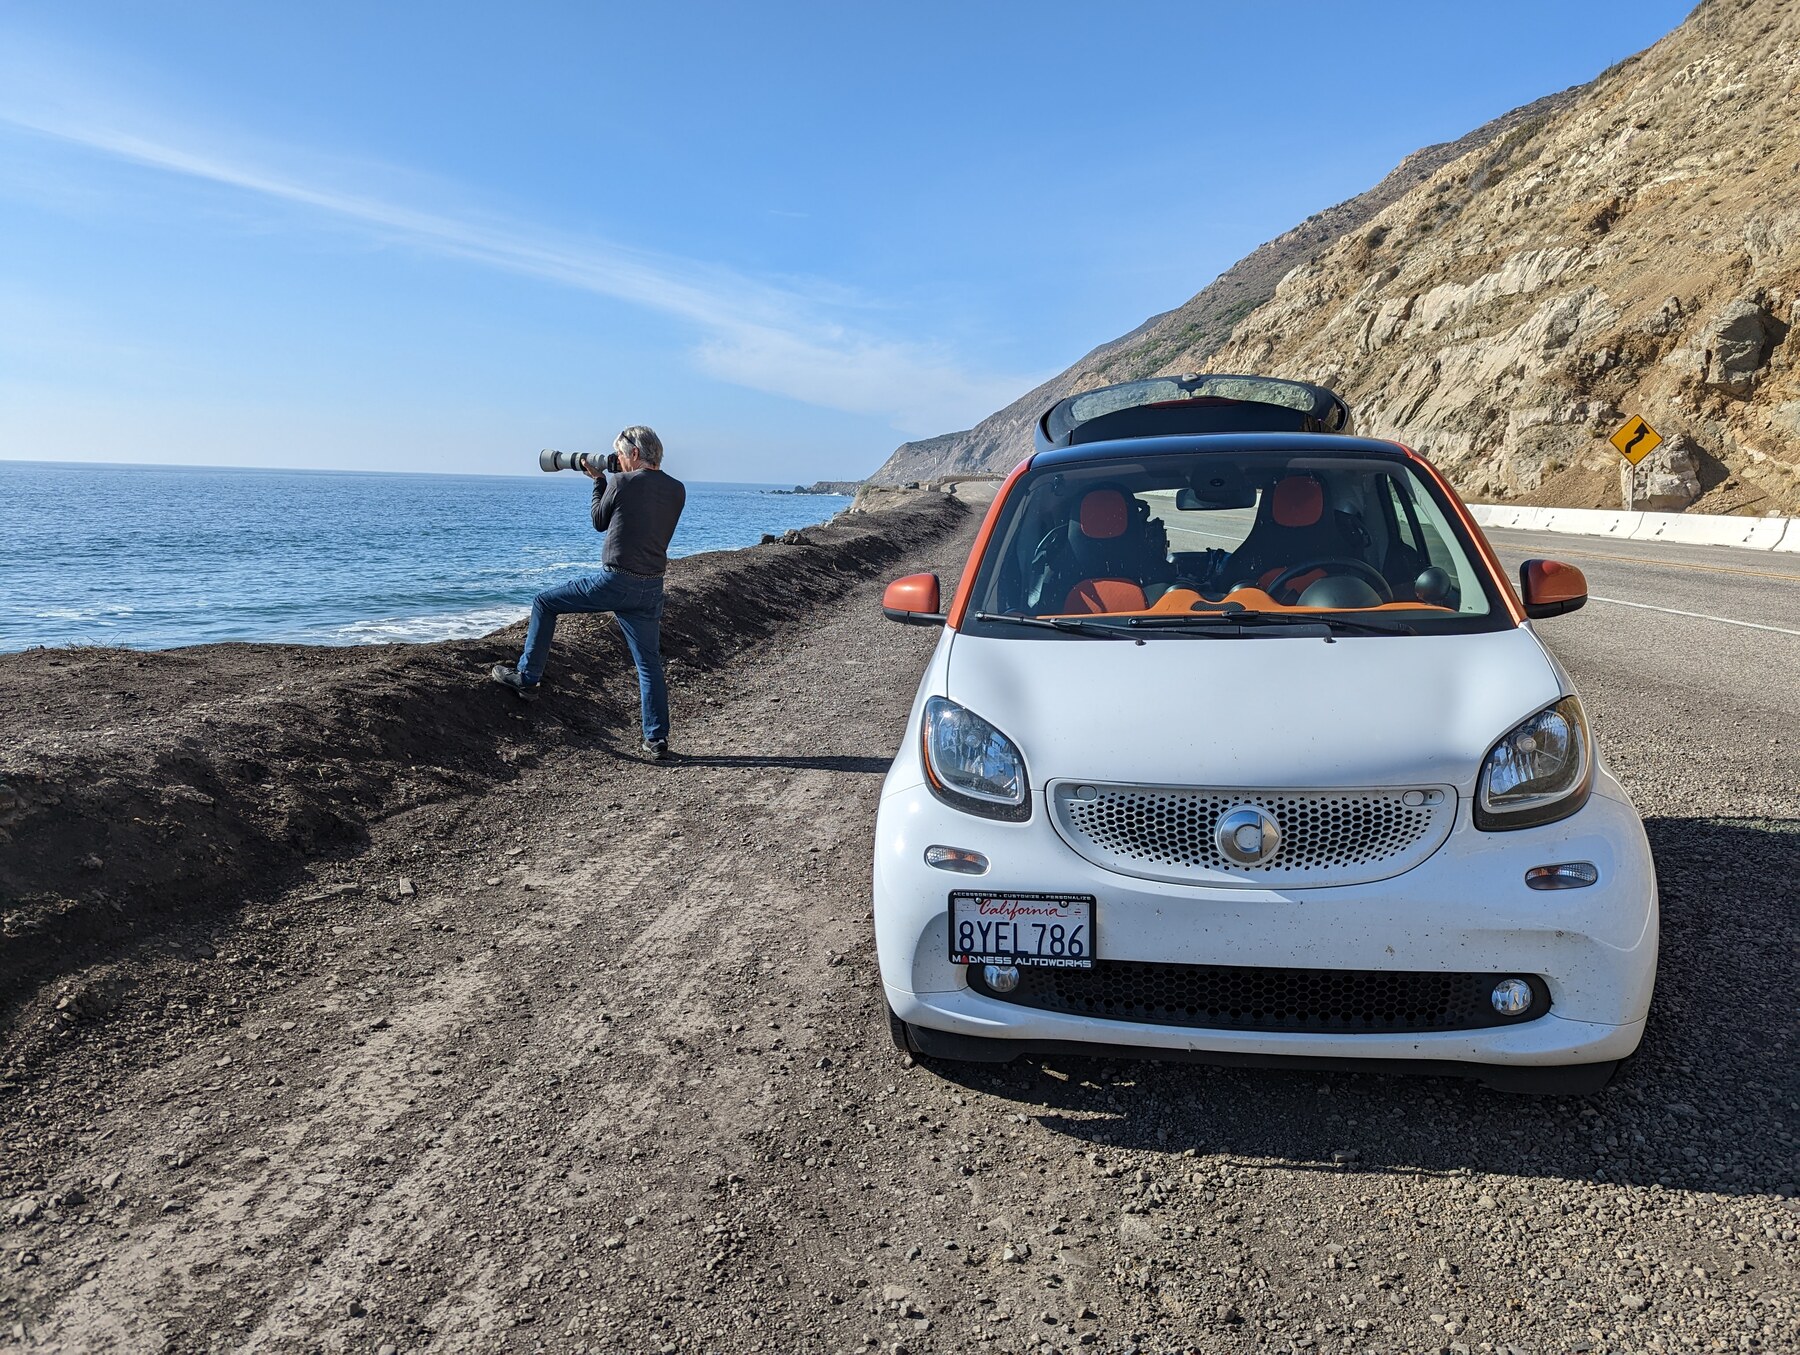
I’d have told you the driving was the trip. The one column I filled in for no reason says otherwise, and it says so at p = 2.4e-07, which is a strange way to learn something you already knew.
12.8 What I’d do differently
There’s a lesson in all of this and it isn’t really about cars.
At the start I didn’t know what to record. I did what seemed logical, which was to ask what mileage the thing got, and what seemed possible, which was however many columns fit across a sheet of paper. I hadn’t thought through what I’d do with the numbers beyond the obvious calculation. What would have been better is to work out ahead of time what answers I’d like to have.
It wouldn’t have taken much. A few minutes of thinking would have produced measures of human performance alongside the measures of car performance, and stopped time is the obvious one. Even a mock-up of the analyses I might one day want would have shown me that. But I was in a hurry, other responsibilities took the time, and things got figured out as I went.
Here’s what that cost, exactly. TwoRed’s sheet has no stopped-time column, so everything this chapter has just shown you can only be asked of the later car. 139 of the record’s 223 legs, 62 percent of it, cannot be asked at all. Six years of driving, and the question doesn’t reach them.
That’s a different kind of loss from the ones in Chapter 10. An error can be corrected and a missing entry can be recovered from a scan. No amount of care recovers a column that was never on the page. It’s the one thing in this project that better analysis cannot repair, and it’s why I’d put the planning above everything else I’ve learned here.
12.9 And one box with no rules in it
But I want to be careful, because there’s a version of that advice this chapter would contradict.
The obvious way to design the sheet properly would have been to add stopped time and a tidy list of reasons for stopping, ticked off from categories. The first of those is right. The second would have thrown away everything you’ve just read.
Look at where the categories in Table 12.1 came from. I read the free text and sorted it. They weren’t available in 2010 and they couldn’t have been, because nobody knows what the categories are until they’ve seen what people actually write. A tidy list made up in advance would have held somebody to see and it would not have held Tom, who is my brother, or Cindy, who is my niece. It’d give you a count and none of the names.
And there’s one row that makes the case better than any argument I can put.
On the seventh of October 2024 the record says Torrance, California to Yuma, Arizona: 301.5 miles, 10 hours, 2.75 of them stopped. The comment says Madness + Cindy.
Four words, and here’s what they’re holding. Madness is Madness Autoworks in Signal Hill, the shop from Chapter 2 that’s serviced both mainland cars for fourteen years. Cindy is my niece, whose driveway in Mentone is one of the parking arrangements in Chapter 3. So that day’s the car coming out of the Torrance garage, calling on the people who look after it, stopping at family on the way past, and then running east into the desert. It’s the whole support network this book has spent three chapters describing, in one row, in four words, in a box nobody required me to fill in.
The columns give you Torrance and Yuma. They can’t give you that.
And there’s a sting in it for me. My own grouping filed that day under somebody to see, and that’s half right at best. I’d no way of knowing Madness was a garage rather than a person, and nothing in the data was ever going to tell me. It took the man who wrote it. So the free text isn’t self-interpreting either, and that’s worth saying in a chapter this pleased with itself about an accidental instrument. The box with no rules keeps what a dropdown would throw away, and it still can’t do the job on its own. You need somebody who was there.
So the rule I’d actually pass on is a pair. Design the structured columns you can foresee, because the analysis you planned comes out of those. And keep one box on the form with no rules in it at all, because that’s where the next column comes from. In this record the box with no rules outperformed the column built for the job.
And the last part matters most. Don’t put off the analysis. Run the data early and often. Running it early is exactly what turns a free-text box into a proper column: 6 of the 7 categories in Table 12.1 are already visible in the first ten comments, and all 7 are there by the 20th, with 15 still to come. The field could have been added years before the record closed. I ran mine after sixteen years. The categories took an afternoon. They’d have taken the same afternoon in 2011, and I’d have had six more years of them.
That’s the part worth handing to somebody else. Not the mileage, and not the errata. The chance to prototype the sheet, run a mock analysis on twenty rows of it, and fix what’s missing before driving the first mile.