Data Grubbing
Getting data into a proper format is one of the challenges of data analysis. Several experiments were performed to see how ChatGPT can (or can’t) help in the data clean-up process.
Messy Spreadsheet
A spreadsheet with pretty messy data was copied and given to ChatGPT. Here is that spreadsheet.
| Sport | Franchise | Start | End |
|---|---|---|---|
| Baseball | MLB | 4/2/2022 | 10/5/2022 |
| Football | NFL | 9/8/2022 | 1/8/2023 |
| Soccer | MLS | 2/26/2022 | 10/9/2022 |
| Golf | PGA Tour | 9/13/2021 | 8/28/2022 |
| Basketball | NBA | 10/19/2021 | 4/10/2022 |
| Auto Racing | NASCAR | 2/6/2022 | 8/27/2022 |
| Hockey | NHL | 10/12/2021 | 4/29/2022 |
| Basketball | Men's NCAA | November 9, 2021 | March 13, 2022 |
| Football | NCAA FBS | August 27, 2022 | December 10, 2022 |
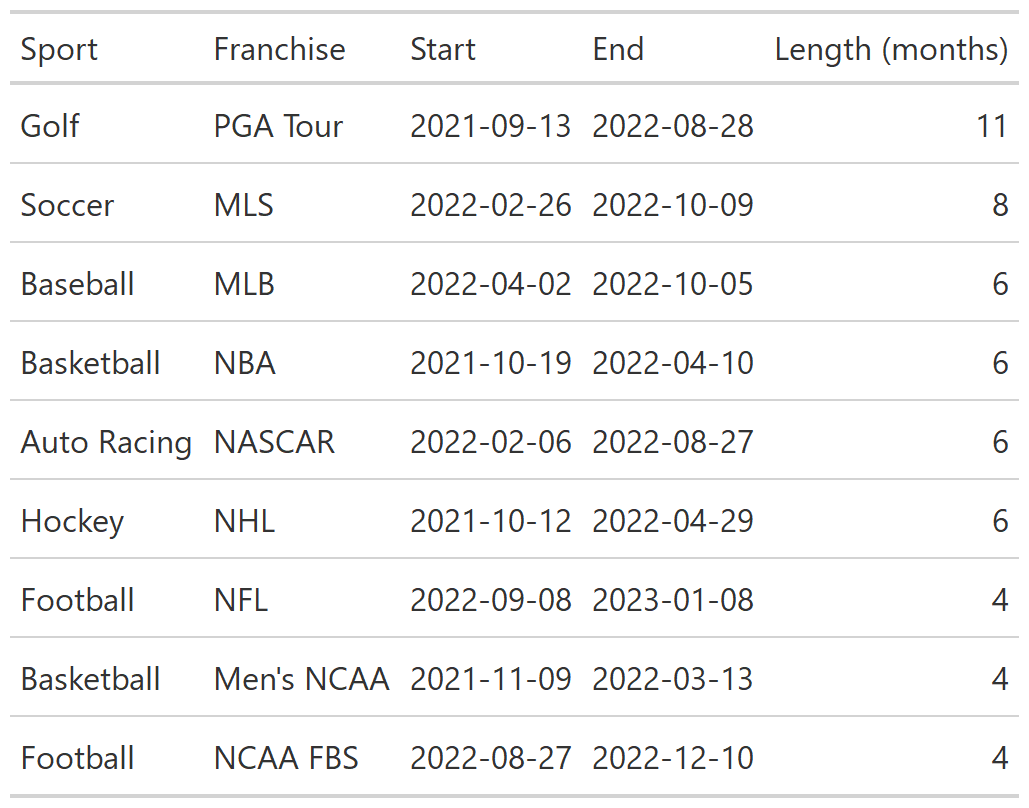
A few rounds of requests were given, such as determining the approximate length of each season and to sort in descending order. Finally a request was entered to have the data formatted as a CSV file for use in R. This was pasted into R and a few standard commands added (library, output using gt). Here is the result:
Data Extraction
I provided a set of data that I got from scraping a website. Here is the URL:
https://tidesandcurrents.noaa.gov/benchmarks/1612340.html
It’s a pretty messy table. I trimmed out some of the text as there was too much text for ChatGPT to handle. Then I gave the following request.
The following table has identification information and geographic locations of benchmarks in the Honolulu, Hawaii, region. Extract either the Designation or Station ID for each benchmark location, along with its longitude and latitude. Put these in a table. Here is the data:
A cut-and-paste sample of the input to ChatGPT follows.
Station ID: 1612340 PUBLICATION DATE: 12/12/2003
Name: HONOLULU, HONOLULU HARBOR, OAHU ISLAND
HI
NOAA Chart: 19367 Latitude: 21° 18.4' N ( 21.30670)
USGS Quad: HONOLULU Longitude: 157° 52.0' W (-157.86700)
T I D A L B E N C H M A R K S
PRIMARY BENCH MARK STAMPING: B.M. ELV. 8.06 FEET
DESIGNATION: 161 2340 BM 8
MONUMENTATION: Bench Mark disk VM#: 23
AGENCY: US Geological Survey (USGS) IDB PID#: TU0286
SETTING CLASSIFICATION: Concrete bulkhead OPUS PID:
LATITUDE: 21° 18.3' N ( 21.30519) LONGITUDE: 157° 51.8' W (-157.86397)
BENCH MARK STAMPING:
DESIGNATION: 161 2340 TIDAL 2
ALIAS: 2 1872
MONUMENTATION: See descriptive text VM#: 22
AGENCY: Hawaiian Government Survey Department IDB PID#: TU0283
SETTING CLASSIFICATION: Stone pilaster base OPUS PID:
LATITUDE: 21° 18.3' N ( 21.30553) LONGITUDE: 157° 51.6' W (-157.85983)
U.S. DEPARTMENT OF COMMERCE
National Oceanic and Atmospheric Administration
National Ocean Service
Page 2 of 9
Station ID: 1612340 PUBLICATION DATE: 12/12/2003
Name: HONOLULU, HONOLULU HARBOR, OAHU ISLAND
HI
NOAA Chart: 19367 Latitude: 21° 18.4' N ( 21.30670)
USGS Quad: HONOLULU Longitude: 157° 52.0' W (-157.86700)
T I D A L B E N C H M A R K S
BENCH MARK STAMPING: NO 11 1925
DESIGNATION: 161 2340 TIDAL 11
MONUMENTATION: Tidal Station disk VM#: 25
AGENCY: US Coast and Geodetic Survey
(USC&GS) IDB PID#: TU0284
SETTING CLASSIFICATION: Concrete foundation OPUS PID:
LATITUDE: 21° 18.3' N ( 21.30575) LONGITUDE: 157° 51.8' W (-157.86389)
BENCH MARK STAMPING: NO 12 1925
DESIGNATION: 161 2340 TIDAL 12
MONUMENTATION: Tidal Station disk VM#: 26
AGENCY: US Coast and Geodetic Survey
(USC&GS) IDB PID#: TU0288
SETTING CLASSIFICATION: Concrete floor OPUS PID:
LATITUDE: 21° 18.4' N ( 21.30631) LONGITUDE: 157° 51.6' W (-157.86036)
I got a table with just what I’d asked for as data fields. The locations were in DMS format so I asked for a conversion to the decimal format. Then I asked for the data to be formatted as a CSV file for use in R. The following lines are the result.
"Designation/Station ID","Latitude","Longitude"
"161 2340 BM 8",21.30519,-157.86397
"161 2340 TIDAL 2",21.30553,-157.85983
"161 2340 TIDAL 11",21.30575,-157.86389
"161 2340 TIDAL 12",21.30631,-157.86036
"161 2340 TIDAL 13",21.30569,-157.85792
"161 2340 TIDAL 14",21.30681,-157.85903
"161 2340 TIDAL 20",21.30333,-157.86467
"161 2340 TIDAL 21",21.30383,-157.86367
"HONOLULU GSL 2340",21.30392,-157.86289
"161 2340 A",21.30458,-157.86342
"161 2340 B",21.30670,-157.86700
"161 2340 C",21.30542,-157.86061
"161 2340 GPS Bolt",21.30333,-157.86453
Reducing Data Precision
Obtaining geographic coordinates from Google Maps is as simple as right-clicking on a map location and then clicking on the coordinates at the top of the pop-up menu. This copies the latitude and longitude to the clipboard. You can then place these values in an R program by pasting.
Each of the coordinate values has a lot of decimal digits (typically 13 or 14). All that is needed are five decimal places. That’s about 1 meter precision. If you have a lot of values, the deletion of the “extra” decimal digits is tedious.
The following command (with data) was used (just the first few lines are shown):
Reduce the precision of the following numbers to five decimal digits by rounding. Please keep the format the same.
kakaako <- read_csv(col_names = TRUE, file =
"lat, lon
21.29581026845934, -157.86933082782653
21.290453065875973, -157.8611762129575
21.294491797759502, -157.8573570253844
21.293172401795047, -157.8550395867404
The result is just what is needed:
kakaako <- read_csv(col_names = TRUE, file =
"lat, lon
21.29581, -157.86933
21.29045, -157.86118
21.29449, -157.85736
21.29317, -157.85504
This saved a lot of time.
Data Extraction and Clean-up
I entered some travel data with the following request.
Here is a set of data. Make it into a CSV file.
1/19/23 (Thursday): 10:24 AM: LV Tokyo Station (Platform 22) on Shinkansen Kagayaki 509 to Kanazawa
1/21/23 (Saturday): 9:02 AM: LV Kanazawa on Thunderbird No 14 to Kyoto
1/24/23 (Tuesday): 10:13 AM: LV Kyoto on Hikari 633 to Shin-Osaka
1/24/23 (Tuesday): 11:18 AM: LV Shin-Osaka on Sakura 553 (platform 21) to Hiroshima Station
1/25/23 (Wednesday): 10:55 AM: LV Hiroshima Station on Sakura 549 (platform 11) to Kagoshima-chuo
1/25/23 (Wednesday): 12:33 PM: LV Hakata on Midori No. 27 (platform 4)to Takeo-onsen
1/25/23 (Wednesday): 1:58 PM: LV Takeo-onsen on Bullet Train Kamome No. 29 (platform 11) to Nagasaki
1/26/23 (Thursday): 11:45 AM: LV Nagasaki Station on Kamome No. 24 to Takeo-onsen
1/26/23 (Thursday): 12: 16 PM: LV Takeo-onsen on Relay Kamome No. 24 (platform 10) to Shin-tosu
This worked as requested. But I realized the table I would be building would be a bit messy by including the platform information that is found with some of the entries.
I typed in a new request:
Please remove the platform information and make the CSV file again. The response follows:
Sure, here is the revised CSV file with the platform information removed:
Day,Time,Departure Location,Train,Destination
Thursday,1/19/23,10:24 AM,Tokyo Station,Shinkansen Kagayaki 509,Kanazawa
Saturday,1/21/23,9:02 AM,Kanazawa,Thunderbird No 14,Kyoto
Tuesday,1/24/23,10:13 AM,Kyoto,Hikari 633,Shin-Osaka
Tuesday,1/24/23,11:18 AM,Shin-Osaka,Sakura 553,Hiroshima Station
Wednesday,1/25/23,10:55 AM,Hiroshima Station,Sakura 549,Kagoshima-chuo
Wednesday,1/25/23,12:33 PM,Hakata,Midori No. 27,Takeo-onsen
Wednesday,1/25/23,1:58 PM,Takeo-onsen,Bullet Train Kamome No. 29,Nagasaki
Thursday,1/26/23,11:45 AM,Nagasaki Station,Kamome No. 24,Takeo-onsen
Thursday,1/26/23,12:16 PM,Takeo-onsen,Relay Kamome No. 24,Shin-tosu
This worked just right. There were even some typing corrections made.
Structuring Taxonomic Records
The material came from a PDF scan of a book. OCR had been done on the page, but that was quite a few years ago so there are some artifacts. Some of these artifacts were corrected before submitting to ChatGPT. Here is the request.
The following text contains herbarium records of Halodule uninervis. I need a table that structures these data in a format where I can compare the various properties. Here is the text: WESTERN AUSTRALIA.. Carnarvon, washed ashore in the mouth of the Gascoyne
River, 15-9-1967, a. den Hartog 540 (L); south-west of Carnarvon, in mangrove
creek, forming a belt in front of the Avicennia pneumatophores, on rather soft,
sandy mud, 16-9-1967, a. den Hartog 556 (L); Carnarvon, in mangrove creek on
Babbage Island, 16-9-1967, 0. den Hartog 559 (L); Carnarvon, Shark Bay, interspersed
in the Posidonia australis meadows, 17-9-1967, 0. den Hartog 567 (L).
QUEENSLAND. Thursday Island, on coral sand, low-littoral, fl.., 11-11-1967, 0. den
Hartog 1007 (L); on the north-eastern side of the island, very narrow-leaved form,
in the middle part of the eulittoral belt on firm sand and mud as well as in shallow
depressions, 12-11-1967, a. den Hartog 1025 (L). Cairns, Yule Point, on compact
mud, below low-water mark, 1-11-1967, 0. den Hartog 943 (L); Cairns, Double
Island, very common on muddy and sandy substrata, 30-10-1967, a. den Hartog
918 (L); Green Island near Cairns, on sand bank about low-tide mark, 17-8-1963,
S. T. Blake 22086 (K); very common on coral sand, 29-10-1967, 0. den Hartog 908
(L). Townsville, between Cape Pallarenda and Shelly Beach, on eulittoral mud-flat,
5-10-1967, 0. den Hartog 739 (L); Townsville, Magnetic Island, Cockle Bay, in
muddy sand on dead reef platform, 5-10-1967, 0. den Hartog 727 (L); sandy beach
of Cockle Bay, narrow-leaved speci mens in the intertidal belt, fr. in sublittoral,
5-10-1967, 0. den Hartog 732 (L).
The response provided a nicely formatted table. However, I couldn’t copy the table for use here as the format characters are not recognized. Instead, I asked ChatGPT to create a CSV file.
"Location","Specific Location","Description","Date","Collector","Number","Herbarium"
"Western Australia","Carnarvon, mouth of the Gascoyne River","Washed ashore","15-9-1967","a. den Hartog","540","L"
"Western Australia","South-west of Carnarvon, in mangrove creek","Forming a belt in front of the Avicennia pneumatophores, on rather soft, sandy mud","16-9-1967","a. den Hartog","556","L"
"Western Australia","Carnarvon, in mangrove creek on Babbage Island","","16-9-1967","o. den Hartog","559","L"
"Western Australia","Carnarvon, Shark Bay","Interspersed in the Posidonia australis meadows","17-9-1967","o. den Hartog","567","L"
"Queensland","Thursday Island","On coral sand, low-littoral","11-11-1967","o. den Hartog","1007","L"
"Queensland","North-eastern side of Thursday Island","Very narrow-leaved form, in the middle part of the eulittoral belt on firm sand and mud as well as in shallow depressions","12-11-1967","a. den Hartog","1025","L"
"Queensland","Cairns, Yule Point","On compact mud, below low-water mark","1-11-1967","o. den Hartog","943","L"
"Queensland","Cairns, Double Island","Very common on muddy and sandy substrata","30-10-1967","a. den Hartog","918","L"
"Queensland","Green Island near Cairns","On sand bank about low-tide mark","17-8-1963","S. T. Blake","22086","K"
"Queensland","Green Island near Cairns","Very common on coral sand","29-10-1967","o. den Hartog","908","L"
"Queensland","Townsville, between Cape Pallarenda and Shelly Beach","On eulittoral mud-flat","5-10-1967","o. den Hartog","739","L"
"Queensland","Townsville, Magnetic Island, Cockle Bay","In muddy sand on dead reef platform","5-10-1967","o. den Hartog","727","L"
"Queensland","Sandy beach of Cockle Bay","Narrow-leaved specimens in the intertidal belt, fr. in sublittoral","5-10-1967","o. den Hartog","732","L"
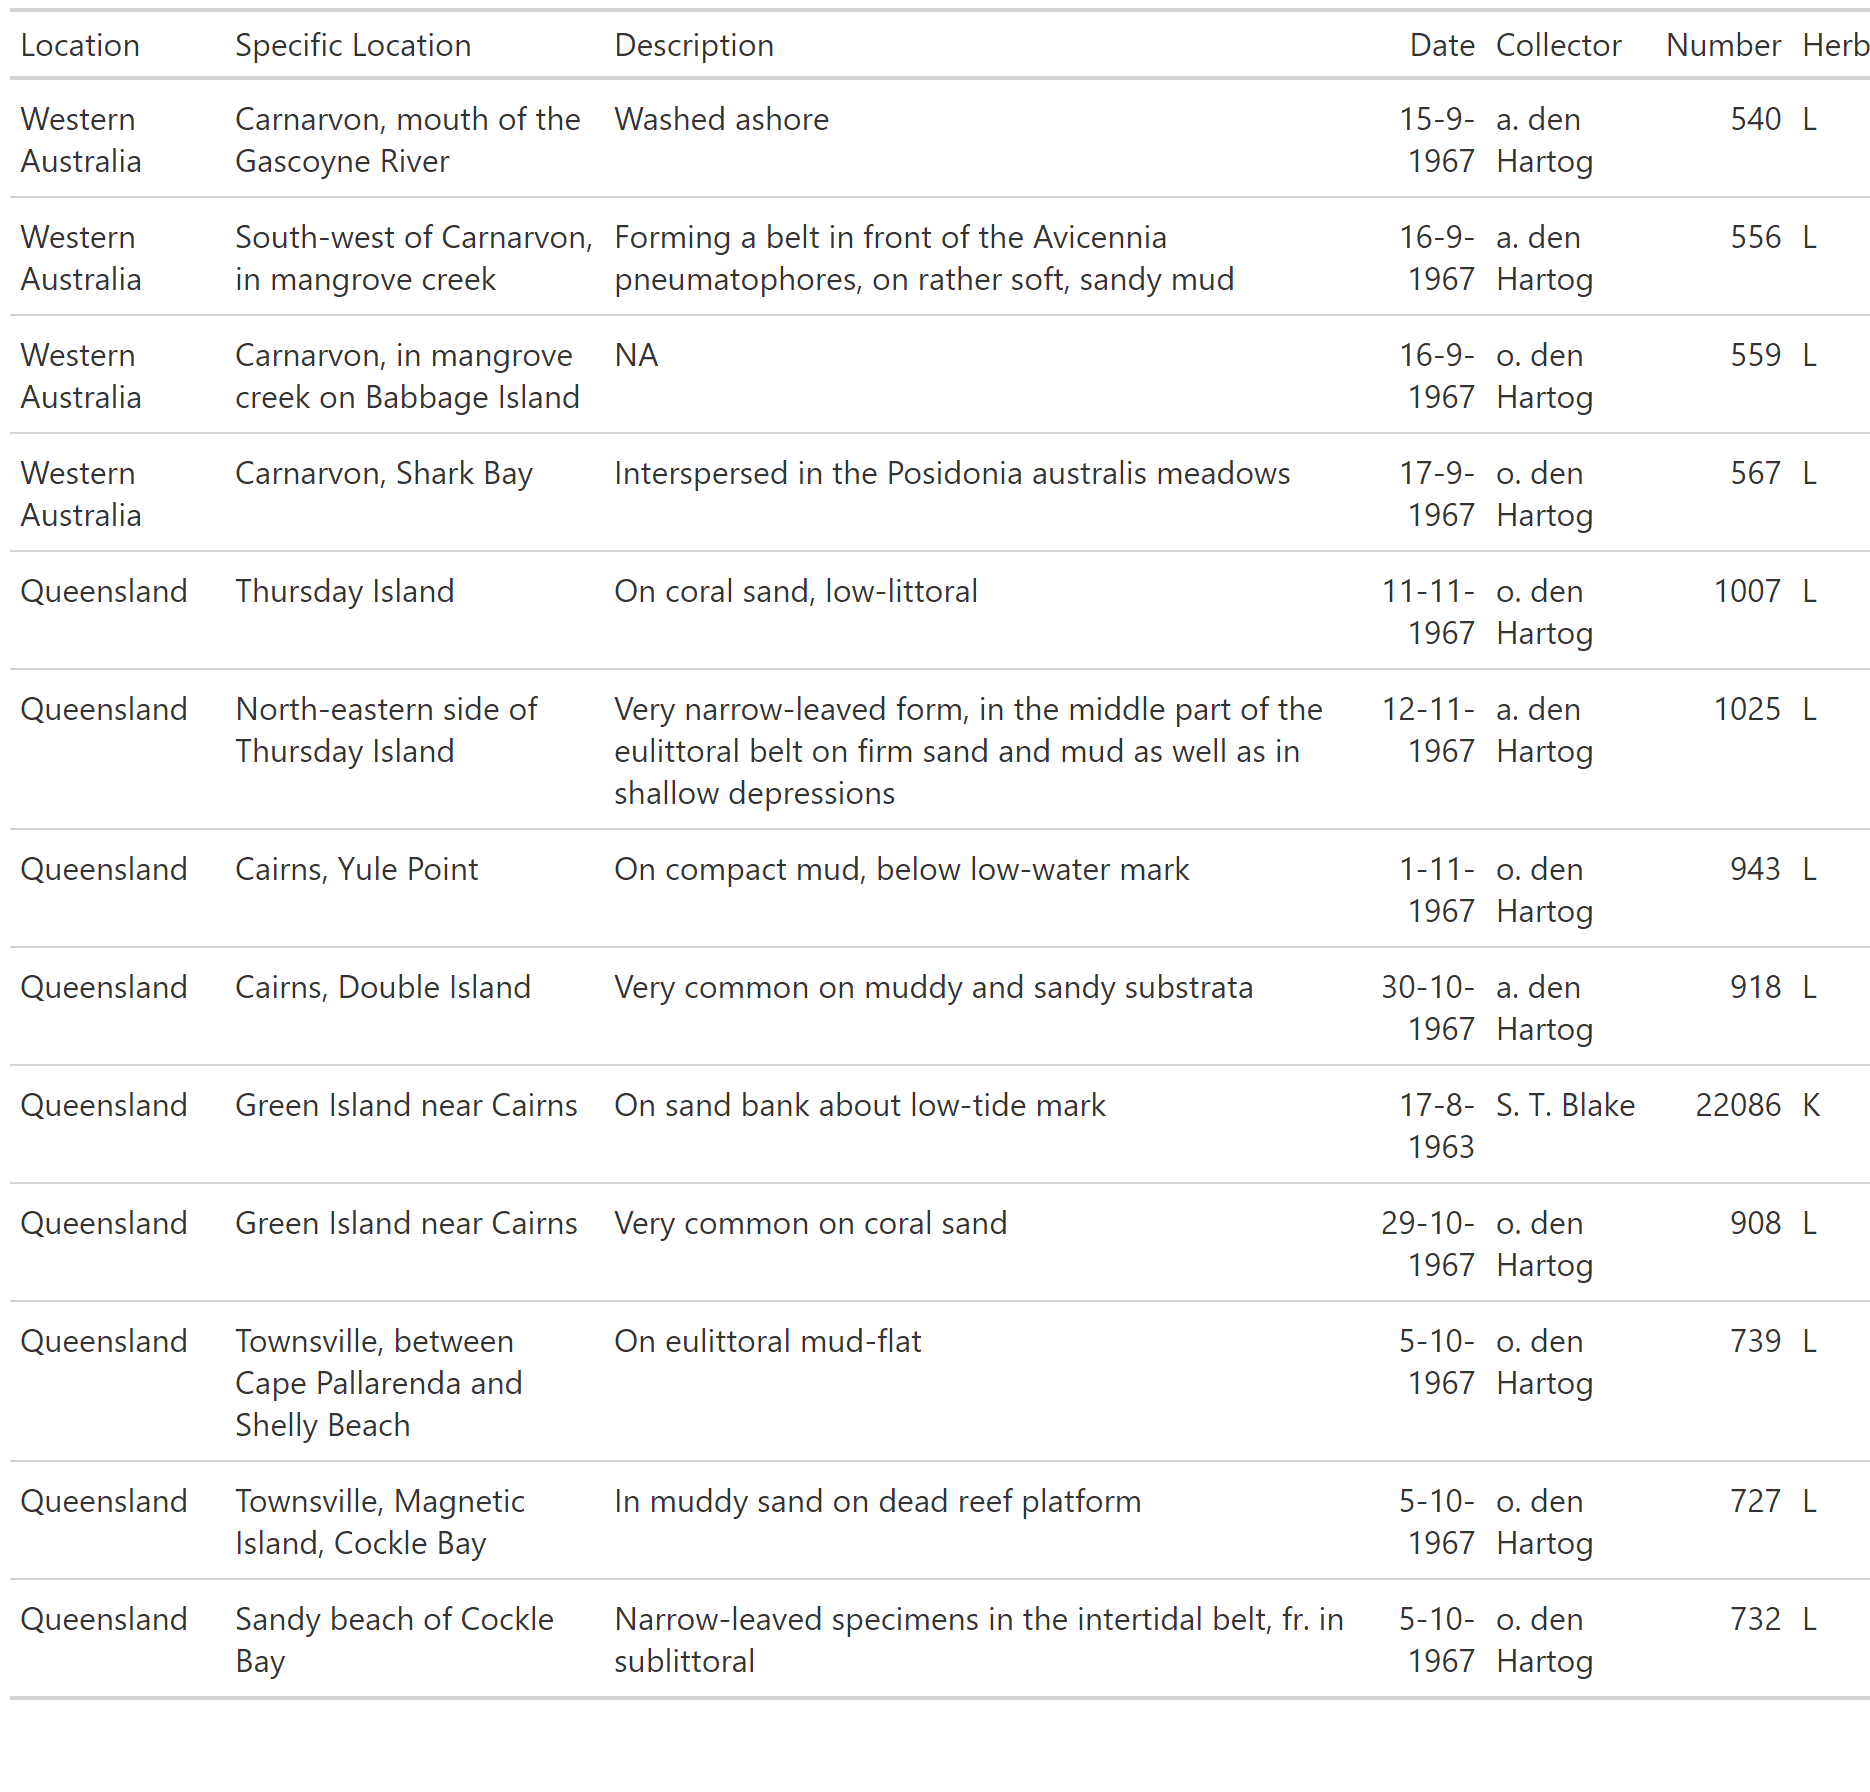
The CSV file was processed in R with the following result. Note that it is possible to do a bit of clean-up, but this table, as it is, shows the potential for the reformatting done with ChatGPT.
 Cut-and-Paste from a Website
The spring training schedule for Chicago Cubs games is given on their website. A quick highlighting and copying was done of the first few items in the schedule. This was pasted into Notepad and then copy-and-pasted into ChatGPT. A lot of extra text came in using this procedure.
The request follows. Note that there were many, many lines of text that didn’t apply to the question that were not edited out prior to submitting the text for ChatGPT processing. Just a few of those are included here, along with a few lines showing the format of the schedule data.
The following data show the Chicago Cubs home game schedule for 2023. Please make it into a neat table.
Chicago Cubs Tickets
High Demand Event
ORDER WITH CONFIDENCE
The checkout cart is encrypted and verified by Norton for your privacy. Every order is backed by a guarantee that your ticket will arrive before the event. Please note that the checkout cart is hosted by and orders are processed by a third-party platform. For more details, please view the Terms & Privacy Policy (Link opens in new tab).
[ A large section of text is not shown here.]
SAT
FEB 25
1:05 PM
Spring Training - San Francisco Giants at Chicago Cubs
Sloan Park – Mesa, AZ
MON
FEB 27
1:05 PM
Spring Training - Cleveland Guardians at Chicago Cubs (Split Squad)
Sloan Park – Mesa, AZ
WED
MAR 01
1:05 PM
Spring Training - Seattle Mariners at Chicago Cubs
Sloan Park – Mesa, AZ
THU
MAR 02
1:05 PM
Spring Training - Oakland Athletics at Chicago Cubs
Sloan Park – Mesa, AZ
SAT
MAR 04
1:05 PM
Spring Training - Los Angeles Angels at Chicago Cubs
Sloan Park – Mesa, AZ
A neat and concise table was produced. A request was then made for a CSV table to use in R. Here is that result:
Date,Opponent,Time,Venue
2/25/2023,San Francisco Giants,1:05 PM,Sloan Park – Mesa, AZ
2/27/2023,Cleveland Guardians,1:05 PM,Sloan Park – Mesa, AZ
3/1/2023,Seattle Mariners,1:05 PM,Sloan Park – Mesa, AZ
3/2/2023,Oakland Athletics,1:05 PM,Sloan Park – Mesa, AZ
3/4/2023,Los Angeles Angels,1:05 PM,Sloan Park – Mesa, AZ
This worked well.