# Install package if you don't have it
if (!require("scatterplot3d")) install.packages("scatterplot3d")
library(scatterplot3d)
# 1. Create the Dataset
# Manually recreating the dataframe from the visual data points
colors_df <- data.frame(
year = c(2026, 2026, 2026, 2026, 2026, 2026,
2025, 2025, 2025,
2024, 2024, 2024, 2024,
2023, 2023, 2023, 2023,
2022, 2022, 2022, 2022,
2021, 2021, 2021, 2021,
2020, 2020, 2020, 2020,
2019, 2019, 2019, 2019,
2018, 2018, 2018,
2017, 2017, 2017,
2016, 2016, 2016, 2016),
name = c("Cloud Dancer", "Silhouette", "Universal Khaki", "Hidden Gem", "Warm Eucalyptus", "Warm Mahogany",
"Mocha Mousse", "Cinnamon Slate", "Rumors",
"Peach Fuzz", "Blue Nova", "Upward", "Cracked Pepper",
"Viva Magenta", "Raspberry Blush", "Redend Point", "Blank Canvas",
"Very Peri", "October Mist", "Evergreen Fog", "Breezeway",
"Illuminating", "Ultimate Gray", "Urbane Bronze", "Aegean Teal",
"Classic Blue", "First Light", "Naval", "Back to Nature",
"Living Coral", "Metropolitan", "Cavern Clay", "Blueprint",
"Ultra Violet", "Caliente", "Oceanside",
"Greenery", "Shadow", "Poised Taupe",
"Rose Quartz", "Serenity", "Simply White", "Alabaster"),
hex = c("#F0EEE9", "#4A413C", "#BCA68E", "#6A867F", "#7A8B78", "#9D4A3C",
"#A47864", "#AA8C96", "#8A3324",
"#FFBE98", "#5B6C91", "#B4BEC3", "#4E5052",
"#BE3455", "#D25A46", "#AE8E7E", "#F0ECE2",
"#6667AB", "#A3AA9E", "#95978A", "#B8CBC0",
"#F5DF4D", "#939597", "#545E60", "#647882",
"#0F4C81", "#EBE1E1", "#2F3D4C", "#97A878",
"#FF6F61", "#AFB4B4", "#D1866A", "#4D6C8C",
"#5F4B8B", "#AF2D2D", "#195564",
"#88B04B", "#5F505F", "#8C827D",
"#F7CAC9", "#92A8D1", "#F3F4ED", "#EDEAE0")
)
# 2. Extract RGB values from HEX codes
# Using col2rgb to get the matrix and transposing it to columns
rgb_vals <- t(col2rgb(colors_df$hex))
colors_df$R <- rgb_vals[, 1]
colors_df$G <- rgb_vals[, 2]
colors_df$B <- rgb_vals[, 3]
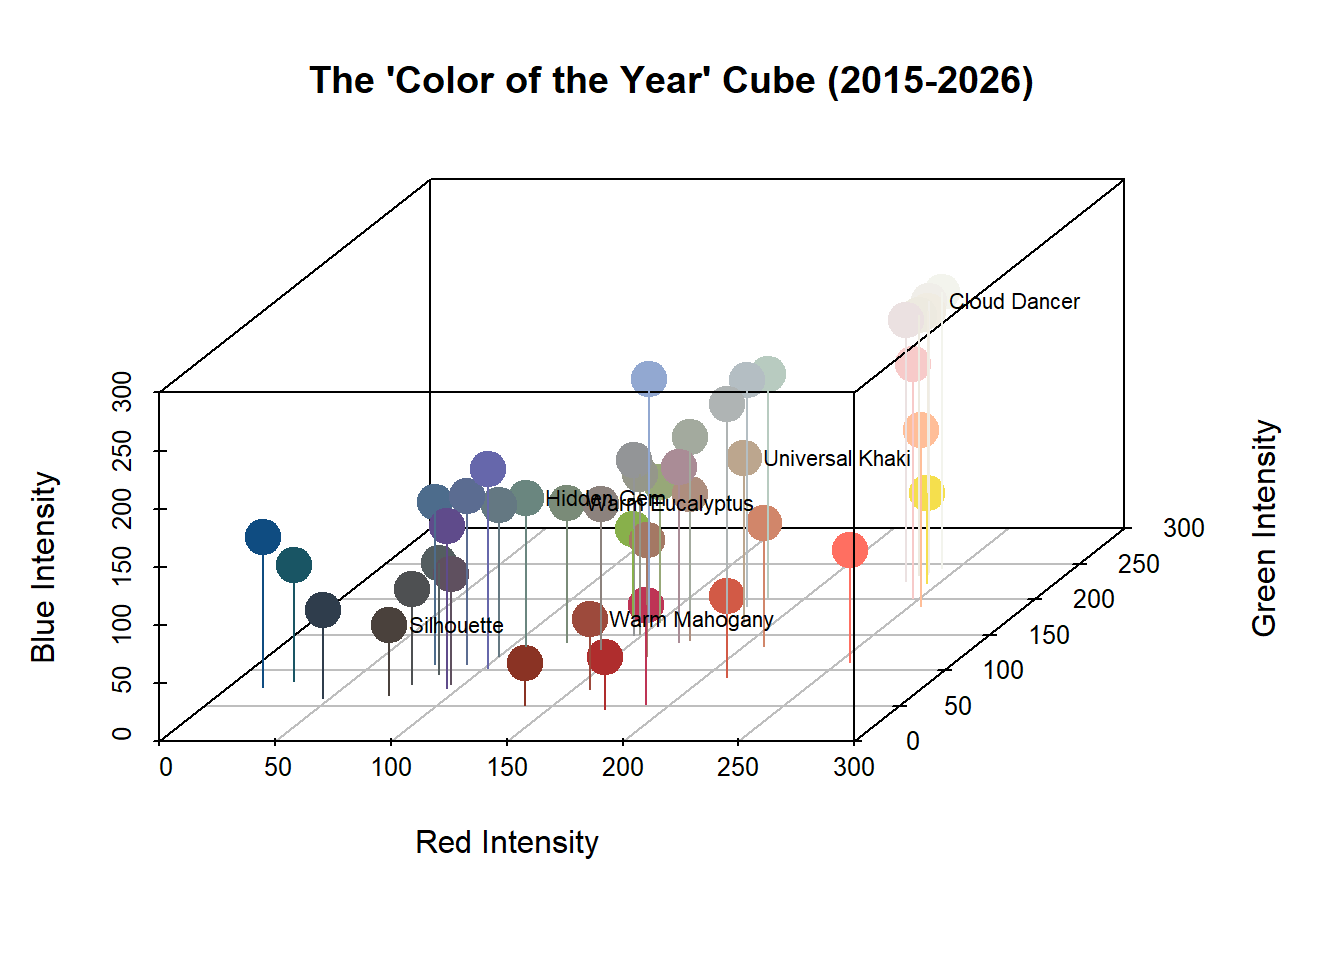
# 3. Plotting with scatterplot3d
# Adjust margins for better label visibility
par(mar=c(5, 5, 5, 5))
s3d <- scatterplot3d(
x = colors_df$R,
y = colors_df$G,
z = colors_df$B,
color = colors_df$hex, # Use actual paint colors for the points
pch = 19, # Solid circle
cex.symbols = 2.5, # Size of dots
# Axes settings
xlim = c(0, 255),
ylim = c(0, 255),
zlim = c(0, 255),
xlab = "Red Intensity",
ylab = "Green Intensity",
zlab = "Blue Intensity",
# visual tweaks
angle = 55, # Angle of view
grid = TRUE,
box = TRUE,
main = "The 'Color of the Year' Cube (2015-2026)"
)
# 4. Adding Drop Lines (stems) to anchor points to the floor
# This helps visualization in 3D space
s3d$points3d(colors_df$R, colors_df$G, colors_df$B,
col = colors_df$hex,
type = "h", # 'h' for vertical lines
pch = " " # no character at the end of the line
)
# Optional: Add text labels for the year 2026
data_2026 <- subset(colors_df, year == 2026)
text_coords <- s3d$xyz.convert(data_2026$R, data_2026$G, data_2026$B)
text(text_coords$x, text_coords$y, labels = data_2026$name,
pos = 4, cex = 0.7, col = "black")