Show the code
## install once with: remotes::install_github("kimbridges/seasonalityr")
library(seasonalityr)
library(tidyverse)The scatter at the end of the last chapter was a promising start, and no more than that. Twenty-one cities, each chosen because it was a clear case, sorted into regimes that made sense. But clear cases are easy. The real test of a classification is what happens when you apply it with no cases chosen in advance, to every place on a continent at once, and see whether the result is a coherent map or a field of confetti.
That is what this chapter does. The same rule from Chapter 5, unchanged, is run on every land cell of four regions of the world. Nothing is hand-placed. Each cell brings its own twelve months of temperature and rainfall and its own latitude, gets its three channels measured and its regime assigned, and is colored by the result. If the cue regimes are real, neighboring cells should mostly agree, and the regimes should gather into regions a geographer would recognize. They do, and each of the four maps shows a different part of the framework doing its work.
## install once with: remotes::install_github("kimbridges/seasonalityr")
library(seasonalityr)
library(tidyverse)Two functions do it. compute_regime_grid() crops the cached WorldClim rasters to a rectangle of the globe, computes the indices and the daylength channel for every land cell, and classifies each one with the same classify_v2() rule. regime_map_region() wraps that in a map, drawing the cells in the regime palette and adding labeled city anchors for orientation. One call builds a region.
## the labelled anchors that orient the reader on the map
anchors <- tibble(name = c("Los Angeles", "Las Vegas", "Tucson", "El Paso"),
                  lat  = c(34.05, 36.17, 32.22, 31.76),
                  lon  = c(-118.24, -115.14, -110.97, -106.49))

## crop WorldClim to the extent, classify every land cell, draw the map
regime_map_region(xmin = -125, xmax = -93, ymin = 14, ymax = 52,
                  title   = "Western North America — cue regimes",
                  file    = "map_NA.png",
                  anchors = anchors)
Each map below was built this way. Because every map crops and classifies tens of thousands of cells from the full WorldClim grid, the maps are generated once and shown here as images rather than rebuilt on every render. The four regions were chosen the way the cities were, to give each regime a fair stage.
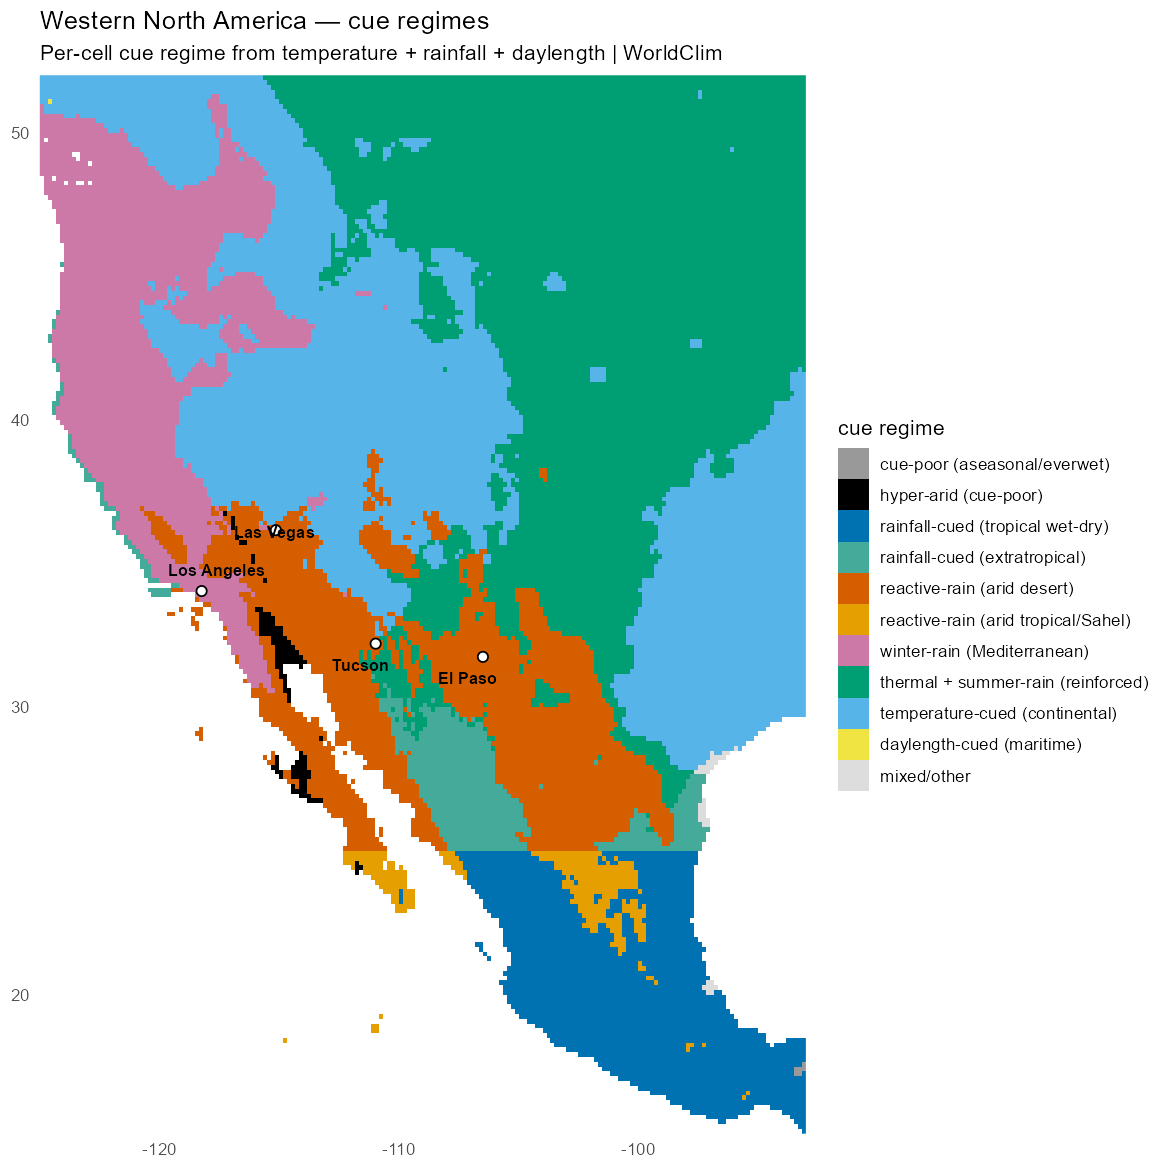
The map that contains our running example puts the desert trio exactly where it should be. Las Vegas, Tucson, and El Paso all sit inside a single contiguous block of reactive-rain desert, the orange region filling the Southwest, with the deepest cores of hyper-arid black at Death Valley and the lower Colorado, the places too dry for even a reactive rainfall channel. Up the Pacific coast runs the pink Mediterranean strip, the winter-rain country of California. The interior is continental, carried by temperature. And at the bottom of the map the regime turns over completely, into the blue tropical wet-dry of the Mexican monsoon. The hard edges between these regions are the same breaks we walked through on the coastal transect, now seen from above.
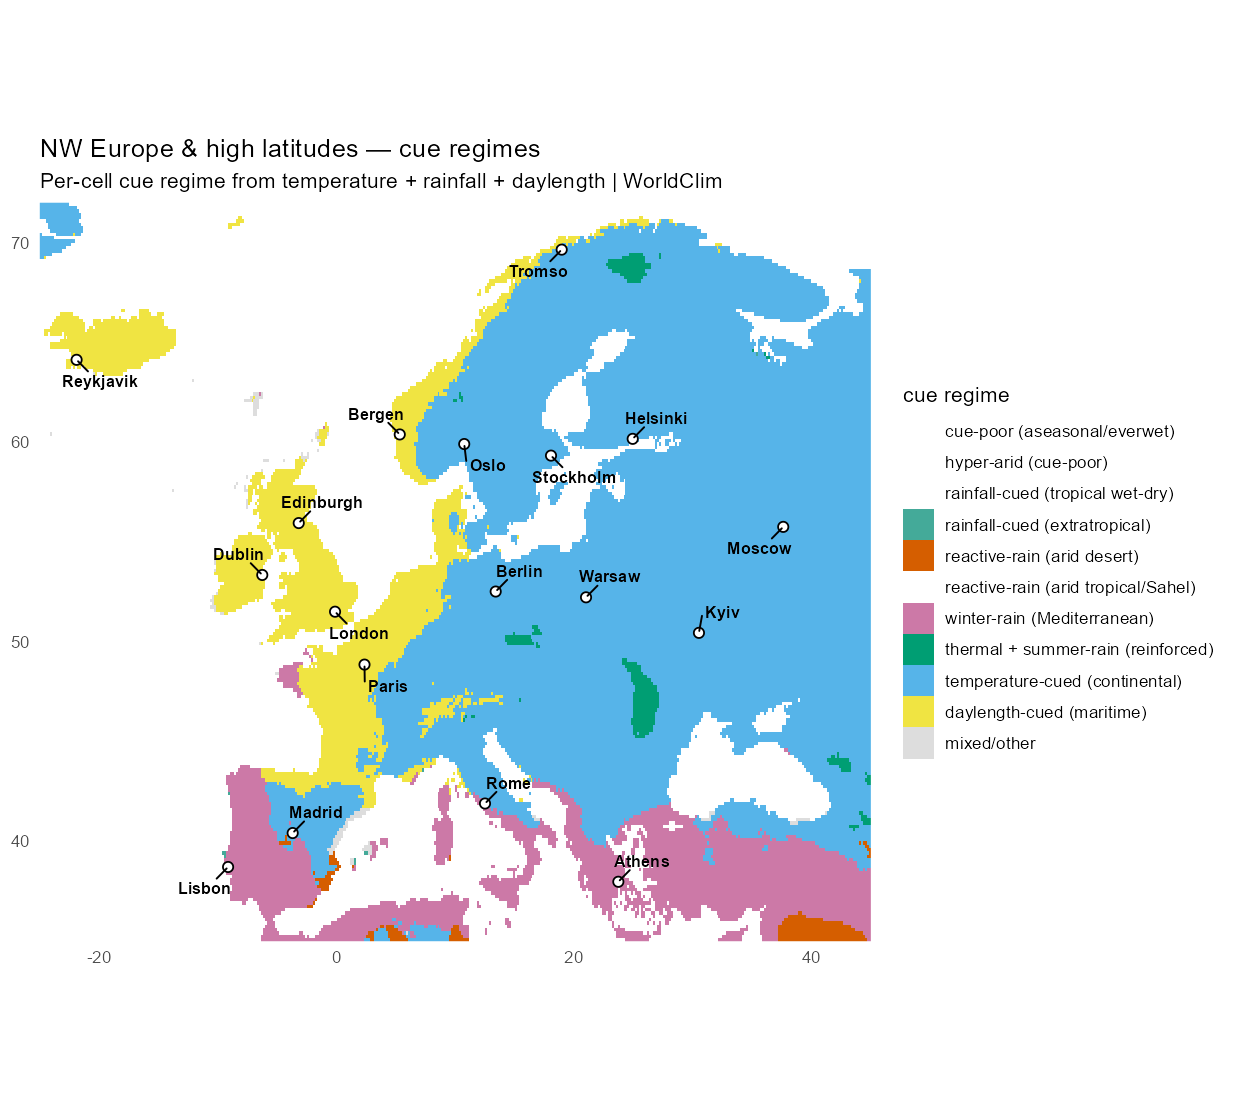
Europe is where the daylength channel earns the place we gave it. The yellow regime, daylength-maritime, traces the Atlantic seaboard almost like a coastline drawn by hand: Iceland, Ireland, Britain, the coast of Norway, the northwest corner of Iberia. These are mild, wet, oceanic places where the temperature swing is small and the rainfall is not strongly seasonal, so the first two channels are both quiet. What is left, and what is loud, is the large swing of daylight at those high latitudes. Without a daylength channel the classifier would have had nothing to say about this whole maritime fringe. With it, the fringe is exactly the coherent, recognizable region it should be. Inland the map turns continental blue, the Mediterranean basin wraps the south in winter-rain pink, and the classifier even finds the single fleck of true desert in Europe, in the rain shadow of southeast Spain.
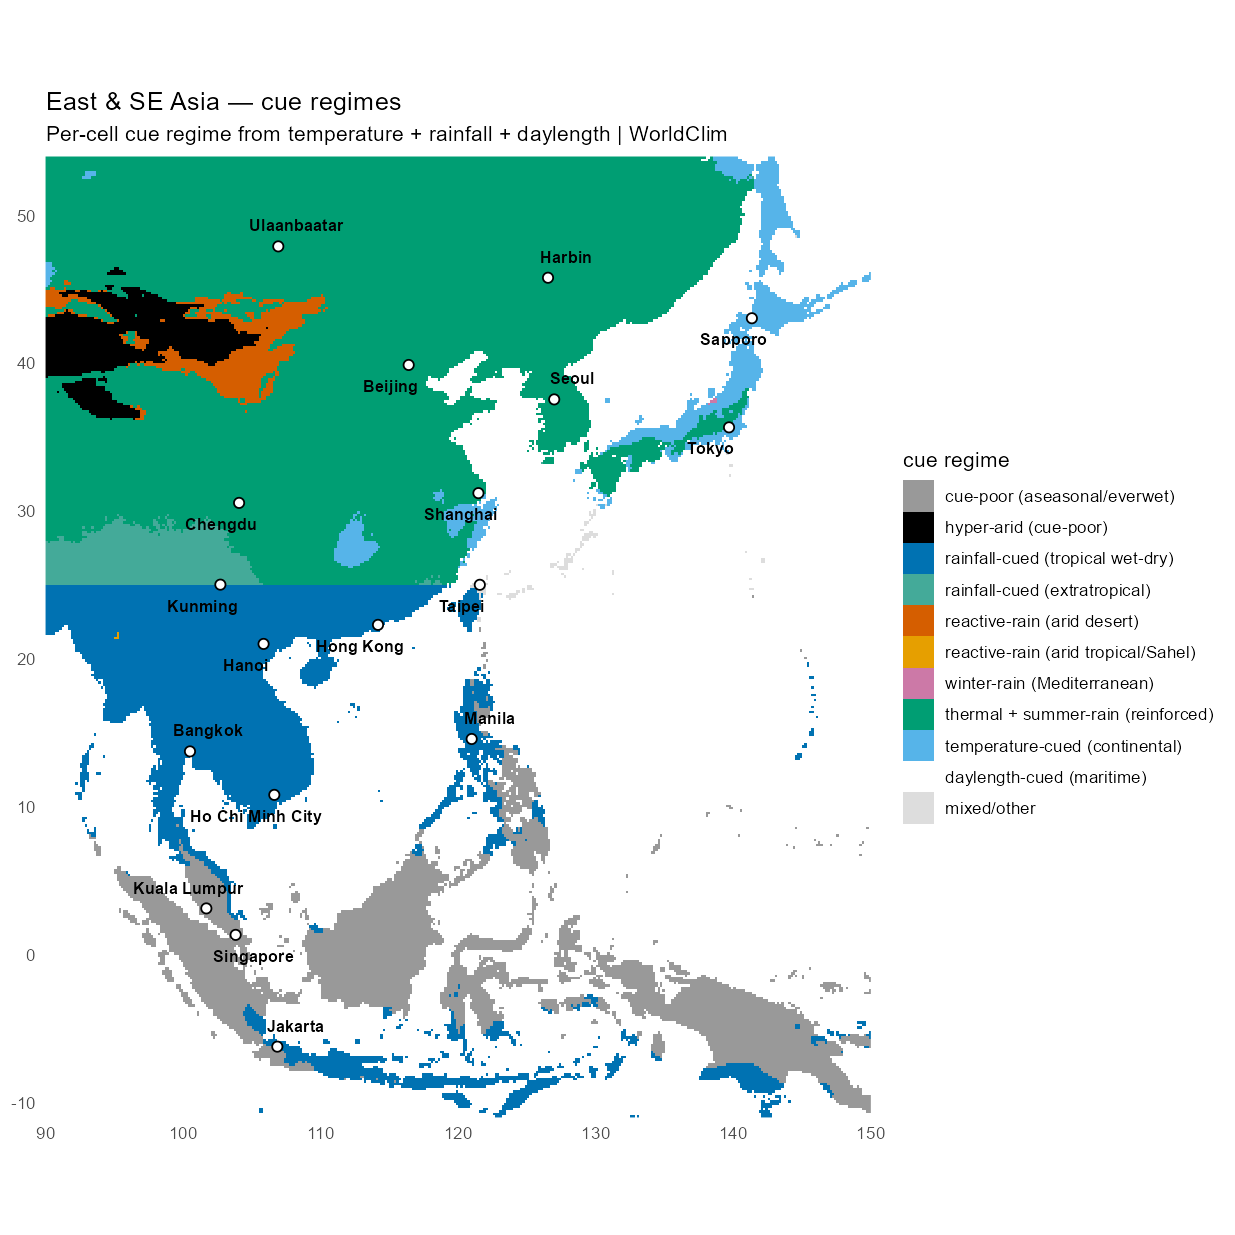
This map validates the keystone of the whole framework. The grey cue-poor regime, the one we argued for from the channel scatter, maps as a single coherent zone over the equatorial heart of the Maritime Continent: Borneo, Sumatra, the Malay Peninsula, New Guinea, with Singapore and Kuala Lumpur inside it. This is the everwet forest, the place where temperature is flat, rain falls in every month, and the equatorial daylength barely moves. All three channels are quiet together, and the map says so over a wide, connected region rather than at a scatter of isolated points. North of it the Asian monsoon splits cleanly in two, reinforced summer-rain green across the Chinese and Korean mainland, tropical wet-dry blue across Indochina and the Philippines, with the divide near 25 degrees. The Gobi appears as hyper-arid cores ringed by reactive desert. And Japan reads as a temperature channel, its rain spread too evenly through the year to be a clock, exactly as the coastal asymmetry in Chapter 3 predicted.
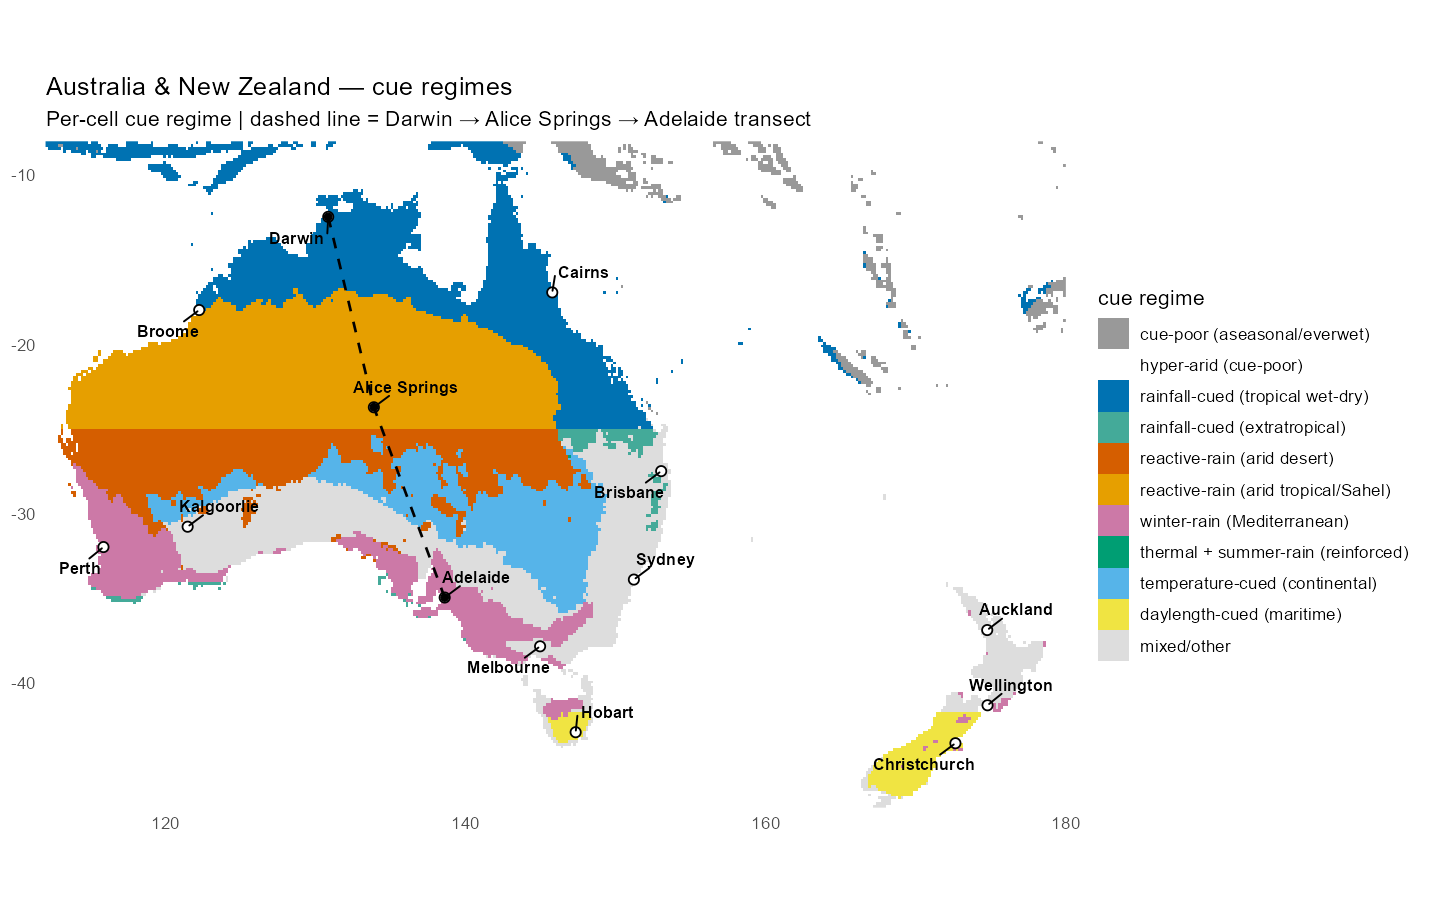
Australia draws the framework as a set of rings. The monsoon north around Darwin is tropical wet-dry. Inside it lies the vast arid core, reactive rain giving way to the driest centre around Alice Springs. And the southern and southwestern coasts, around Adelaide and Perth, are Mediterranean winter-rain. The dashed line is the Darwin to Adelaide transect, a drive that crosses every ring of the continent in turn, monsoon to desert to Mediterranean. Across the water, the South Island of New Zealand and Tasmania come out daylength-maritime, the southern-hemisphere echo of Britain and Norway.
This map is also the one that shows the framework’s honest limit. The grey swath through the southeast, taking in Sydney and Melbourne and the North Island of New Zealand around Auckland and Wellington, is the regime scheme falling silent. These are mild temperate places with year-round rain and, at these middle latitudes, a daylength swing too small to trip the maritime threshold. They fall through every branch of the rule and land in “mixed/other.” It is a real gap, a regime the scheme does not yet have, and rather than paper over it we let the map show it in plain grey. The closing chapter takes it up as the first piece of unfinished business.
Four regions, four continents’ worth of climate, and in every one the same blind rule produced coherent regions rather than noise. The deserts gather, the maritime coasts trace themselves, the everwet core fills in as one connected zone, the monsoon splits where the theory says it should. The categories built from twenty-one cities hold up when applied, with nothing chosen in advance, to the whole map. That is as much as a classification of this kind can be asked to prove, and it is the destination the voyage set out for: not a final model, but a construct carried far enough to redraw the climate geography you already knew as a map of the cues that time the living world. What it cannot yet do, and where it might go next, is the subject of the last chapter.