Here is a number to start an argument. Take the checklist we built, hand it to a standard richness estimator — the kind ecologists trust — and ask how much of the flora it has found. The answer comes back: forty-five percent. Kīpuka Puaulu, one of the most thoroughly botanized forests in all of Hawaiʻi, the type locality of a tree named from its own soil, and the estimator says more than half its plants are still unknown, hidden somewhere off the sheets.
The number is arithmetically correct. It is also almost certainly wrong. Untangling how both can be true is the work of this chapter — and the answer turns out to say more about the botanists than about the forest.
Show the code
## --- Standard packages ---## data handling and graphics (dplyr, readr, ggplot2, ...)library(tidyverse)## formatted tableslibrary(gt)## --- Package from github/kimbridges ---## install once with: install_github("kimbridges/checklistr")library(checklistr)## --- Options ---## suppress read_csv() column-type messagesoptions(readr.show_col_types =FALSE)
4.1 The estimator’s verdict
The estimator is Chao1, and its logic is honest. It looks at how many species were seen exactly once — the singletons — and how many exactly twice — the doubletons. A flora with many singletons relative to doubletons is a flora still turning up surprises: each single sighting hints at others like it, not yet caught. Chao1 turns that intuition into a number, adding an estimate of the unseen to the observed total.
Our checklist gives it a great deal to work with. Of 160 taxa, 105 — 66% — rest on a single record. Feed those singletons and doubletons to Chao1 and it projects a true flora of about 355 species. Against that, our 160 observed taxa are only 45% of the whole. Taken at face value, roughly 195 species remain to be found within two kilometres of the loop trail.
For data gathered the way Chao1 assumes — individuals sampled from plots, where seeing a species once really does mean it is rare — this would be a reasonable, even conservative, verdict. The question is whether these data were gathered that way.
4.2 A second opinion
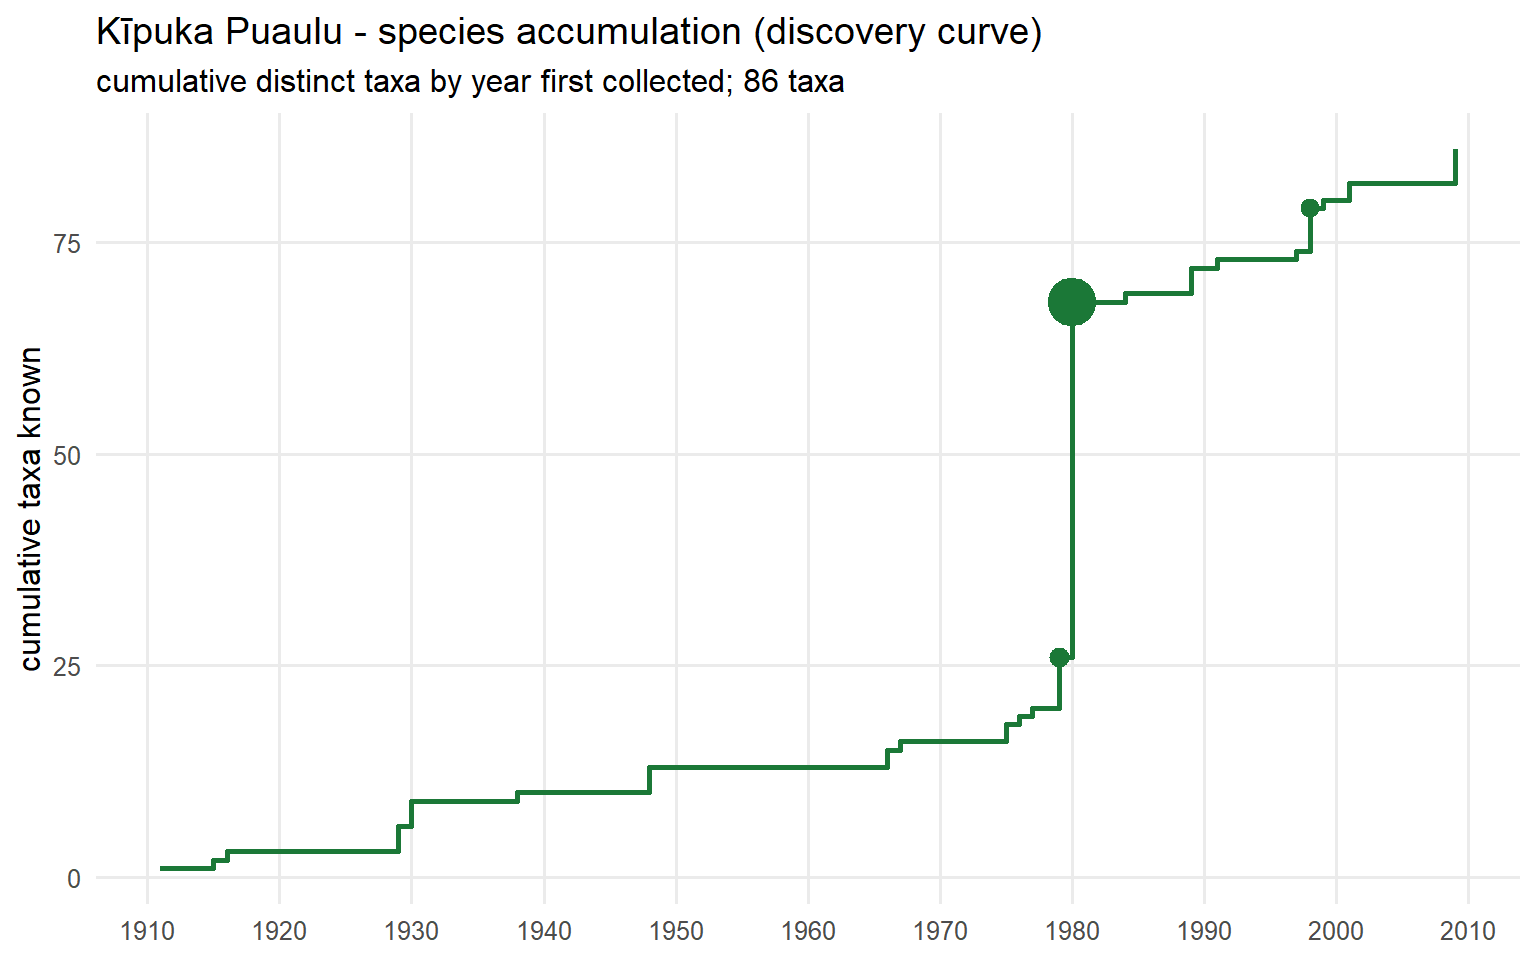
There is another way to ask how complete a flora is, and it needs no assumptions about rarity at all. Simply ask when each species was first collected here. If the forest were still giving up new plants, the count would still be climbing. If it has been worked out, the curve should level off.
Show the code
## the discovery curve, straight from the specimen recordsspecimens <-read_csv("data/kipuka_puaulu_specimens_dedup.csv")plot_species_discovery(specimens, place ="Kīpuka Puaulu")
Cumulative distinct taxa at Kīpuka Puaulu by the year each was first collected. The record inches along for six decades, leaps in the 1979–80 survey, and then flattens — the signature of a flora that has been largely found, mostly in a single episode of effort. Based on the 86 taxa that carry a collection year.
The shape tells a different story than Chao1 did. For sixty years the record creeps upward a species or two at a time. Then, in 1979–80, a dedicated survey adds nearly fifty species at once — most of the known flora, in a single burst of effort. After that the curve all but flattens: a handful of additions across the following decades, and little that is new. This does not look like a forest half-unknown. It looks like a forest that was thoroughly walked, once, and has held few surprises since.
Two respectable methods, opposite conclusions. Chao1 says the flora is barely half-found; the discovery curve says it was essentially found in one season, forty years ago. Both cannot be right, and the disagreement is not a flaw in the data. It is the most informative thing the data have to say.
4.3 Why the two disagree
The reconciliation is the argument of the previous chapter, arriving to collect its debt. Chao1 assumes ecological sampling — that a species seen once was seen once by chance, a rare plant briefly caught, promising a long tail of others as rare. But herbarium collecting is taxonomic (Chapter 3): one good sheet per species is enough, so a species is very often collected once on purpose. Under that habit a singleton signals nothing about rarity. It signals that the collector already had what they needed and moved on.
So the 66% singleton fraction that Chao1 reads as a vast unseen flora is, for the most part, not a signal of missing species at all. It is the fingerprint of how botanists collect. Fed that fingerprint, Chao1 faithfully manufactures some 195 phantom species that the discovery curve knows were never there. (It does not help that n_records is not abundance in the first place — it counts how often a plant was collected, not how many grow — so even the estimator’s raw input is the wrong kind of quantity.)
This suggests a more useful way to read the estimator than as a broken oracle. Run an abundance estimator on herbarium data and it does not measure the flora; it measures the collecting. The 45% is not a statement about how many plants grow at Kīpuka Puaulu. It is a diagnostic that the plants here were gathered taxonomically — one representative at a time — and that reading could be genuinely useful across many collections, as a way to characterize how a place was worked. What it must not become is a universal verdict. Kīpuka Puaulu is one collecting history, not the template for every forest; another place, worked differently, would tell the estimator a different story, and the next chapters begin to show what that variation looks like.
4.4 What completeness can mean here
If the tidy percentage lies, what is the honest answer? For herbarium-built checklists, completeness is better read from time than from rarity — from whether discovery has saturated. By that measure Kīpuka Puaulu scores well: the curve has flattened, the recent decades add little, and the checklist is a fair account of the vascular plants that have been collected here.
Two limits keep even that claim modest. A flattening curve can mean the flora was exhausted — or merely that collecting stopped; the record cannot always tell the two apart. And neither method can see a plant that was never digitized into GBIF, or never pressed at all: this is completeness relative to the digitized record, which is not the same as completeness relative to the forest. The checklist is, in the end, as complete as the collecting and the databasing that produced it — no more, and honestly, no less.