A checklist is made by people. Behind every record is a collector who stood in the forest on a particular day and gathered a plant. This chapter looks at who they were and when they came — because the pattern of their visits is the first thing the records reveal, and it shapes everything the checklist can and cannot say.
At Kīpuka Puaulu the story has three acts: a sparse era of early botanists, a single intensive survey that dominates the record, and a scatter of modern visits. The names and dates are recovered from the herbarium labels themselves.
Show the code
## --- Standard packages ---## data handling and graphics (dplyr, readr, ggplot2, ...)library(tidyverse)## formatted tableslibrary(gt)## --- Package from github/kimbridges ---## install once with: install_github("kimbridges/checklistr")library(checklistr)## --- Options ---## suppress read_csv() column-type messagesoptions(readr.show_col_types =FALSE)
2.1 A century of visits, in one figure
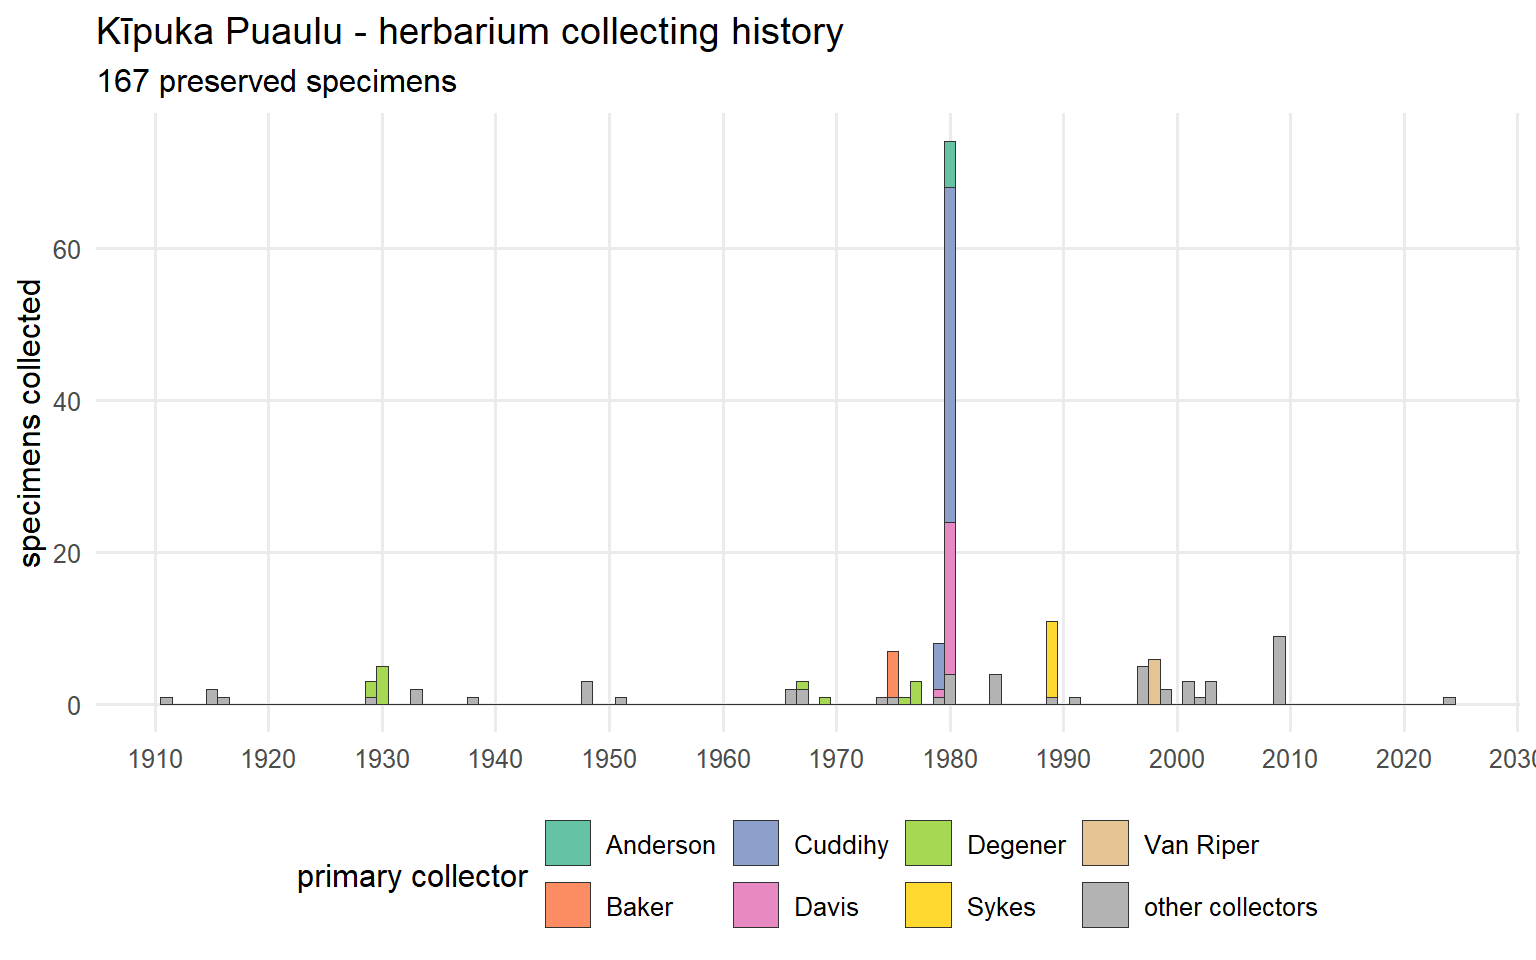
The records span more than a hundred years. Coloring each year’s specimens by who collected them shows the shape of that century at a glance.
Show the code
## the saved, deduplicated specimen recordsspecimens <-read_csv("data/kipuka_puaulu_specimens_dedup.csv")## the collecting history, colored by primary collectorplot_collecting_history(specimens, place ="Kīpuka Puaulu")
Preserved specimens from Kīpuka Puaulu by year, colored by primary collector. The record is nearly flat for six decades, then a single tall column — the 1979–80 survey — towers over everything before or since.
The single tall column is the whole story in miniature. From 1911 to the late 1970s, 167 specimens accumulate a few at a time — an early botanist here, a passing collector there. Then, in 1979 and 1980, one survey adds more specimens than the previous six decades combined. After it, the record thins again to occasional modern visits. Across the whole span, 29 collectors are named, but they did not contribute equally.
2.2 The survey that made the list
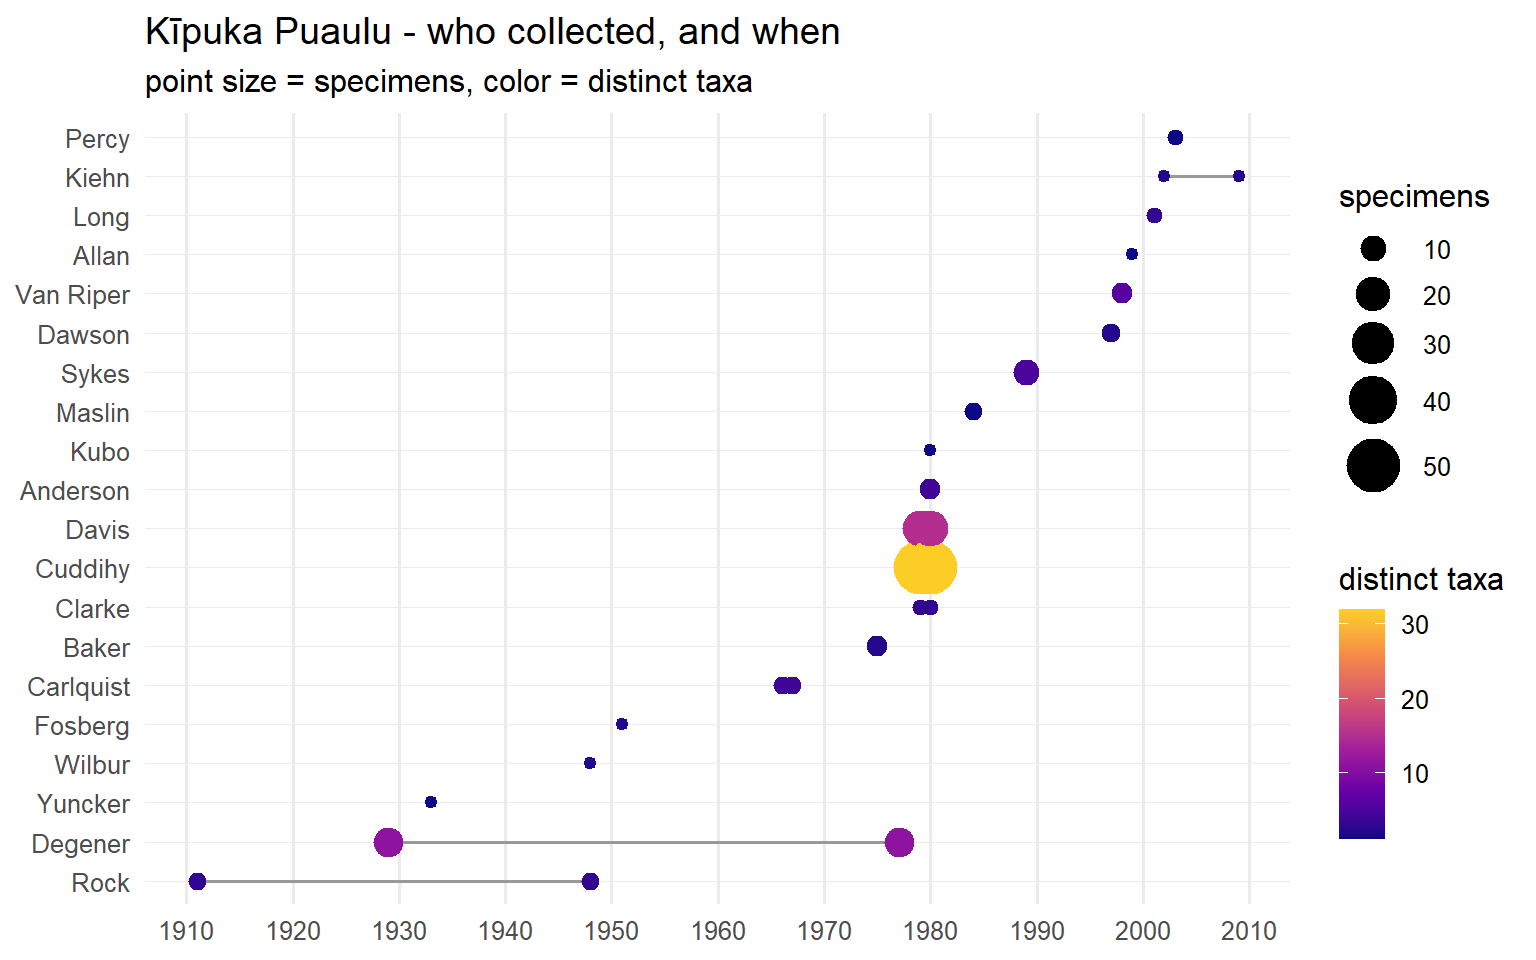
Look at the collectors individually and the dependence becomes concrete.
Show the code
## who collected, and whenplot_collector_activity(specimens, place ="Kīpuka Puaulu")
Each collector’s window of activity. Point size is the number of specimens; color is the number of distinct taxa. One collector — Cuddihy, in 1979–80 — is both the largest and the most taxon-rich point on the plot.
The largest, brightest point belongs to a single collector working a single pair of years: Cuddihy, whose 1979–80 effort alone accounts for 32 of the checklist’s taxa, 25 of them collected by no one else. The early names — Rock, Degener, Fosberg — are the discovery era, thin but historically deep (Degener’s own records span nearly fifty years). The right side of the plot is the modern scatter: small collections, often a single day, adding a species or two.
This is what “campaign-dependent” means. The checklist is not the settled product of a century of steady attention; it is, to a first approximation, the catalogue of what one survey found, lightly padded on either side. That has a direct consequence for the next chapters. The completeness estimate rests on that survey’s thoroughness; the discovery curve’s great leap is this column; and even the determination conflicts are mostly this survey’s sheets, entered twice. Who collected, and when, is not background to the checklist. It is the checklist’s foundation, and knowing its shape is the first step in reading the list honestly.